How to Improve Data Labeling Accuracy and Quality for ML Training

 CEO of Label Your Data
Table of Contents

TL;DR
- Poor data labeling quality causes 87% of ML project failures, making rigorous IAA metrics and systematic QA the difference between production success and wasted development budgets.
- Catching labeling errors at project end costs 10x more than preventing them through pilot testing, cross-validation, and milestone-based quality checks.
- Bad labels create biased loan denials, facial recognition failures, and security breaches that harm real people far beyond your model’s accuracy scores.
The Role of High-Quality Labelled Data in Model Performance
VentureBeat states that about 90% of data science projects don’t reach the production stage. The main reason for this, as found in this report, is that 87% of employees blame data quality issues.
While the labeling process is done according to the set benchmarks of the project, measuring data quality is an inevitable step before the annotation is completed.
Labeled data has a direct impact on the final performance of your model, which is why you should know the key practices for measuring its quality in the annotation process.
Key Methods for Measuring Data Labeling Quality
The process of data annotation is tedious and time-consuming. Since the initial ML dataset can differ in number and complexity, a few people can take part in the quality assurance. To avoid inconsistency in final labels, the data labeling accuracy is controlled on all stages.
To ensure that the quality of data annotation meets the initial guidelines of the project, we refer to various data quality control procedures. From guidelines to final result, they address different aspects of the annotation process.
The most common QA procedures used by annotation teams are listed below.
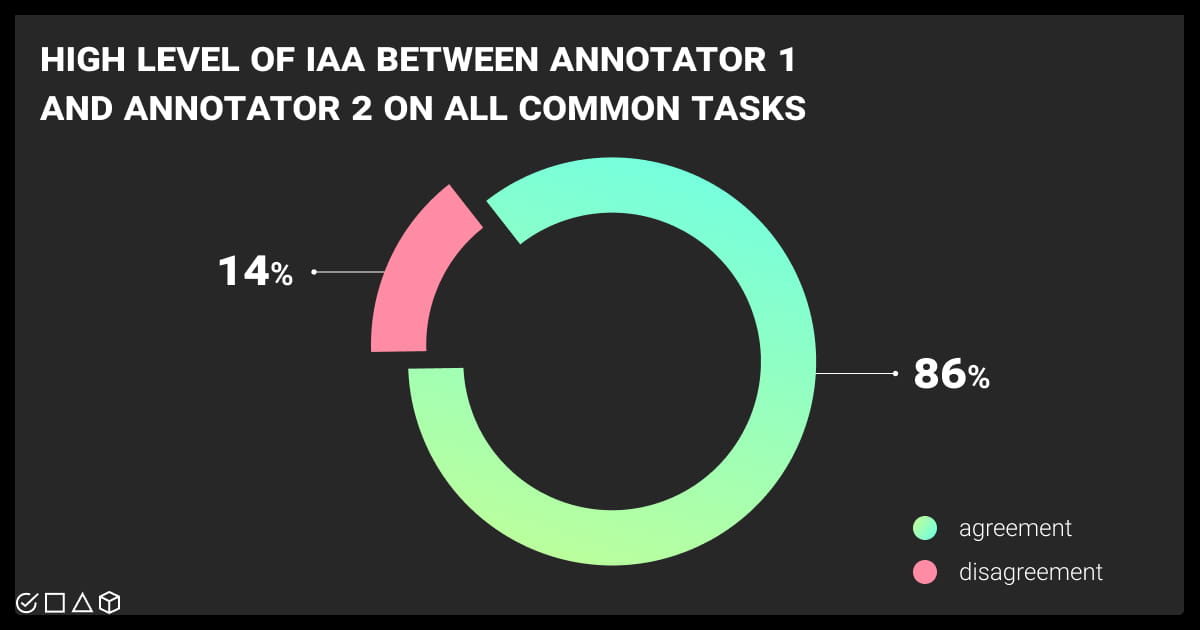
Inter-Annotator Agreement (IAA)
Even though the guidelines are the same for every task, we cannot avoid some level of subjectivity in measuring the final result. To ensure that the approach of every annotator is consistent across all categories of the dataset, we refer to Inter-Annotator Agreement (IAA) metrics. They can apply for the entire dataset, between annotators, between labels, or per task.
The most commonly used metrics include:
- Cohen’s Kappa. This is a statistical coefficient to measure the agreement between two annotators on qualitative categories. In defining how to measure quality of data, reviewers give value 1 for complete agreement, -1 for disagreement, and leave space for chance-level agreement, marking the label with a 0.
- Krippendorff’s Alpha. This metric assesses the reliability of agreement between annotators, whatever their number. It is applicable for various data types, including ordinal, ratio, and nominal. Krippendorff’s Alpha shows a specific level of disagreement for each pair of labels.
- Fleiss’ Kappa. Similar to Cohen’s Kappa, Fleiss’ Kappa allows defining agreement with categorical ratings. However, this metric involves three and more annotators.
- F1 Score. The metric shows the mean between precision and recall, which relate to positive results in predictions and actuals, accordingly. This metric is useful in tasks which have a gold standard, allowing a data labeling quality specialist to assess the quality of labeled data against this standard.
- Percent Agreement. This metric is the simplest, which shows in percentage the amount of data that are annotated with the same labels against the total number of data. The downside is that it doesn’t include the chance agreement and may overestimate the actual result.
IAA metrics help to measure how clearly you understand the initial guidelines and how final data are uniform across all annotators who work on the project. It’s a gatekeeper in validation and reliability of annotation outcomes.
Consensus Algorithm
When multiple annotators work on similar tasks related to the same project, sometimes they cannot avoid discrepancy, especially working with data that requires subjective judgment. For instance, a consensus algorithm may come in handy when you need to evaluate data entry quality control.
As the name suggests, the algorithm serves as a consensus between annotators on which label to use for defined datasets. Basically, every annotator provides their labels for the defined data, and the consensus algorithm applies to determine the final label and measure data quality. This method is considered one of the simplest, as annotators can choose the final label even by simple majority voting. The algorithm is spread across scenarios with manual annotation, specifically in sentiment analysis or image classification.
Cronbach’s Alpha Test
Cronbach’s Alpha is another statistical method to assure the final annotation sticks to defined data labeling standards. In data annotation, the adapted test helps to check consistency and reliability of annotation across the dataset. The reliability coefficient is usually marked with 0 for completely unrelated labeling and 1 for high similarity among the final labels. As a result, the more alpha is closer to 1, the more final labels share in common.
Not only is Cronbach’s Alpha test used for data annotation quality control at the final check of labeled data. It also helps to reassess initial guidelines, refining them if something remains unclear for annotators. Besides, the test is used in pilot studies to proactively eliminate all inconsistencies in further data labeling.
We offer a free pilot for your annotation project. Whatever the industry you’re in, we ensure that the annotation is done accurately, consistently, and meets the initial benchmark.
How to Set Up QA Procedures Using Data Labeling Standards
Developing a systematic quality assurance (QA) process significantly improves labeling quality. This process also follows an iterative cycle. Sometimes, to reduce human disadvantages, you may employ automated tools. Choosing the one that seamlessly integrates into your quality control workflow is crucial for faster resolution of annotation bugs and errors.
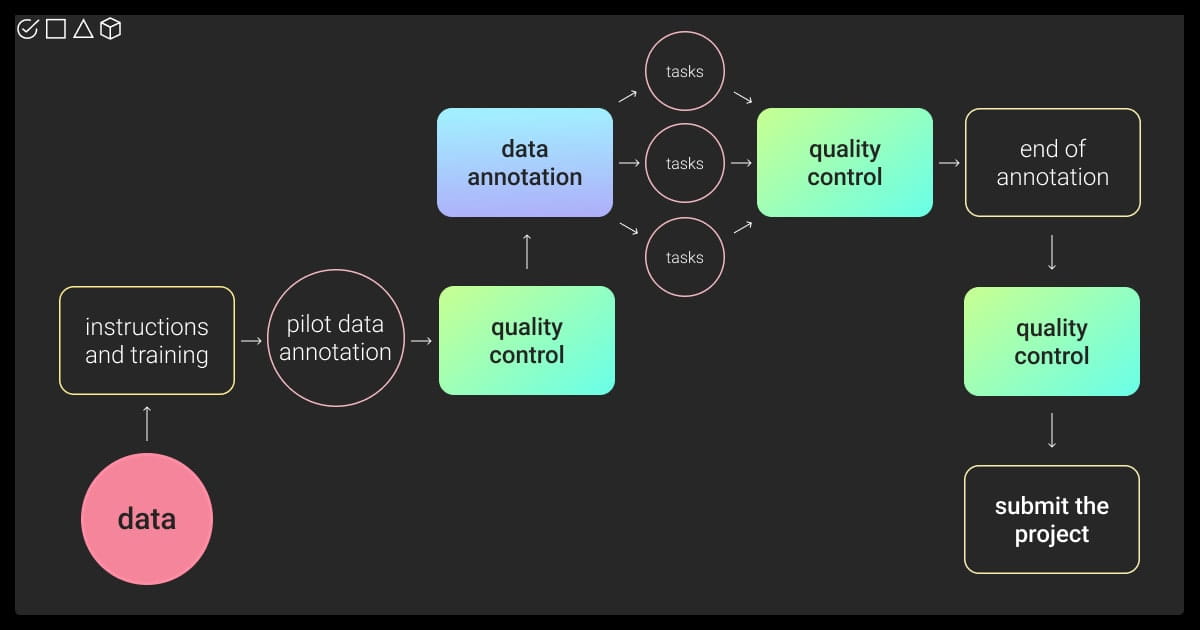
We at Label Your Data have honed a proven QA process that delivers consistent results for our clients:
Step 1: Gather instructions and establish benchmarks
Gather all the instructions for the data to be annotated. They can contain requirements for further ML training, as well as ready examples, which we later use as a benchmark.
Step 2: Train annotators on labeling guidelines
Organize the training for all annotators involved in the project to ensure that the final labels meet the expectations and require no to minimum changes. At this stage, annotators receive all the instructions on how to label that particular dataset.
Step 3: Launch pilot testing and validate data labeling accuracy
Launch a pilot, which usually consists of a small part of the project. Check its quality and compare it to the initial instructions. If it’s approved on the client’s side and the data quality is high, continue with the rest of the dataset.
When dealing with large datasets, divide it into smaller milestones and tasks. Accomplish data quality control after every task, and not only at the end of the project. This helps to save time on corrections and ensure all team members move in the right direction.

 Integration Specialist at Label Your Data
There are two more QA techniques for you to consider:
- Cross-reference QA. This method ensures the final labels are consistent by involving multiple experts performing annotations for further comparison and verification. The main result is to reach consensus between all annotators, especially in matters regarding subjectivity. We had cases where two or three annotators were doing the same task. These are usually the projects that contain datasets of text and maps.
- Random sampling. By randomly selecting multiple labels, we check that the quality corresponds to the project requirements. This approach is more relevant to smaller projects and is used as an extra step to regular quality control checks.
By combining these systematic QA procedures with proven metrics like IAA and consensus algorithms, you can establish robust data labeling standards that prevent costly errors and ensure high-quality labelled data for production-ready ML models.
Consequences of Poor Data Labeling Quality

With poor data, incorrectly trained models can lead to adverse consequences, especially in such areas of AI implementation as medicine or finances. The most common consequences of bad data labeling quality include:
Biased models
Biased models are ML models that produce unfair results, often reflecting prejudices found in the data they’re trained on, or the choices made during development. For instance, an algorithm trained to predict loan riskiness might deny loans to qualified individuals from certain neighborhoods based on historical biases.
Incorrect performance metrics
In machine learning, the evaluation of a model's performance hinges on the quality of data annotation. Inaccurate or inconsistent labels can significantly skew metrics like accuracy, rendering them misleading.
Inefficiency of model development
Inefficiency in ML development arises from poor data labeling quality. In essence, the model is trained on inaccurate ground truth, leading it to learn faulty patterns. Consider an image recognition system: if poorly labeled training data confuses cats and dogs, the model will underperform, requiring significant time and resources for correction.
Constraints of AI adoption
Poor data labeling quality hinders AI adoption. Inaccurate labels confuse the AI, leading to models that underperform or make biased decisions. Imagine if facial recognition software is trained on poorly labeled photos: it might misidentify people, raising privacy and security concerns.
That’s why it is so critical to ensure that the labeled data is of high quality, accurate, and without any discrepancies. Our team of human data experts can help you with moving your ML dataset to the next level, carefully annotating it. All our data annotation services are of high quality and bear ISO/EIC certification.
Most importantly, our manual QA procedures are undertaken by experienced specialists in the field, guaranteeing the highest accuracy. Besides, we work with all types of data, being thus flexible to meet any challenges of your ML project
About Label Your Data
If you choose to delegate data labeling, run a free data pilot with Label Your Data. Our outsourcing strategy has helped many companies scale their ML projects. Here’s why:
Rely on consistent, high-quality output for complex datasets, detailed taxonomies, and edge cases.
Get quality engineered into every step through onboarding, evolving guidelines, QA, and continuous feedback.
Adjust team capacity, project size, and delivery model as you scale, with no setup fees or long-term lock-ins.
Align on goals, workflows, and expectations with a team that integrates into your process from day one.
Work with former annotators who understand annotation complexity, quality standards, and high-volume delivery.
FAQ
What is quality annotation?
Quality annotation refers to the data that is accurately labeled for further usage by the machine learning model. More specifically, these are meticulously labeled data points used to create a dataset that a machine learning model can learn from effectively. This is one of the most critical steps in the whole ML pipeline, since the quality of labeled data will further influence the model performance.
What data quality measures are used in the annotation project?
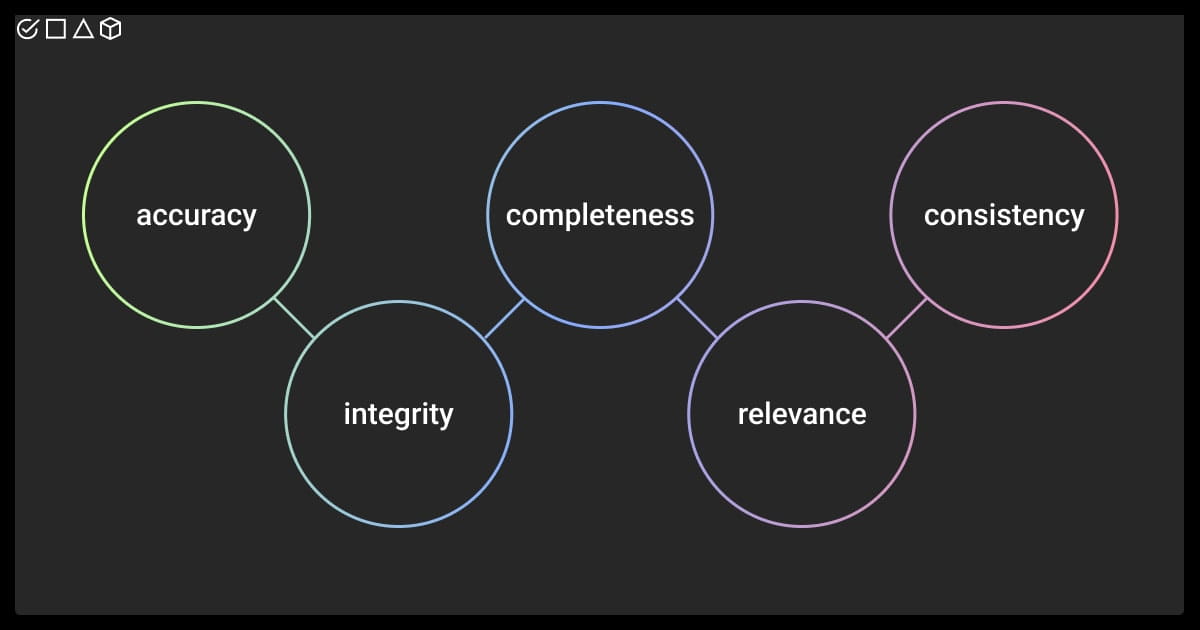
Every project starts with the requirements for data annotation. Every labeled data is checked against the benchmark established as a gold standard. These standards usually include accuracy, consistency, relevance, and completeness of the annotation, which are later measured assessing the degree of inter-annotator agreement (IAA).
How is quality measured in data labeling?
The quality of the final labeled dataset is controlled by tools or manually. Different metrics and methods exist for measuring the quality of data labeling, such as percent agreement, inter-annotator agreement (IAA) metrics, or consensus algorithm, among others. In manual QA, the agreement is usually made on the final label, by comparing the annotations made by a labeler with those made by a reviewer.
How to improve data quality before model training?
- Define clear annotation guidelines with examples and edge cases
- Train annotators thoroughly on labeling standards and project requirements
- Run a pilot test on a small data subset to identify issues early
- Use IAA metrics (Cohen's Kappa, Fleiss' Kappa) to measure annotator agreement
- Implement cross-reference QA with multiple annotators validating the same data
- Conduct random sampling checks throughout the project, not just at the end
- Establish gold standard benchmarks to compare annotations against
- Perform iterative reviews and provide feedback to annotators
- Remove or correct inconsistent, biased, or incomplete labels before training
How to use AI to improve data quality?
- Use automated validation tools to flag inconsistent or outlier annotations
- Apply consensus algorithms to determine final labels from multiple annotators
- Leverage pre-trained models to assist with initial labeling and speed up the process
- Implement AI-powered anomaly detection to identify mislabeled or low-quality data
- Use active learning to prioritize which data points need human review
- Deploy automated quality checks to measure accuracy against benchmarks
- Integrate AI assistants like ChatGPT for text annotation tasks with human validation
- Monitor model performance metrics to identify data quality issues during training
Written by
CEO of Label Your Data
Karyna is the CEO of Label Your Data, a company specializing in data labeling solutions for machine learning projects. With a strong background in machine learning, she frequently collaborates with editors to share her expertise through articles, whitepapers, and presentations.