
AI detects tumors in medical images, tracks faces in security systems, and evaluates crop health using agricultural drones. The sky’s the limit for what you can do with such advanced technologies. But what’s one common thread linking them all? The precision with which they perform object detection.
While object detection may seem like a simple task in computer vision services, it actually requires a nuanced approach to ensure accurate performance. As the name suggests, object detection involves detecting and locating objects within an image or a video frame. Simply put, we train AI to recognize and distinguish between different target objects represented in visual data.
Yet, how do we ensure that the object detected is correct, and that our algorithm performs at its best? That’s when we use object detection metrics. What are they, and how to implement them in computer vision? Let’s explore that!
Basic Object Detection Metrics Explained: Key Terms and Uses
A few words about object detection:
In computer vision, object detection is a major concern. It lays the groundwork for numerous other computer vision tasks, such as AI image recognition, instance and image segmentation, image captioning, object tracking, and so on.
In the image or video ML datasets, objects can be detected either by using traditional methods of image processing or more recent deep learning networks. You can spot object detection in action when looking at its applications like pedestrian and vehicle detection, number-plate recognition, people counting, facial recognition, text detection, or pose detection.
Say you want to train AI to detect and locate all the cars depicted in an image. An object detection algorithm would enable the machine to not only recognize these cars but also draw bounding boxes around each of the target objects to show the actual object locations in the image.
Now, let’s talk about numbers and metrics:
Performance metrics for object detection are quantitative measures used to assess how accurate the algorithm works in computer vision. More specifically, these metrics evaluate the accuracy of detecting, locating, and classifying objects within an image or a video frame. This way, object detection evaluation metrics allow us to compare and optimize the performance of different models used for image classification and object detection.
Object detection metrics are used to assess the model’s predictions by comparing them to the ground truth. It consists of the real object locations and classes as labeled by human annotators. Therefore, an accuracy metric enables the evaluation of the model’s strengths and weaknesses, so that you can adjust its hyperparameters and decode on the most suitable model for a given computer vision task.
Precise computer vision starts with well-annotated data. Get your expert annotation support from Label Your Data!
Exploring Common Object Detection Metrics: Quick Terminology Guide
To identify objects in the image, a model must be first trained on a diverse and representative dataset. It must learn to recognize various objects and their spatial relationships. In this case, professional image annotation services can come in handy.
After model training, it’s time to evaluate its performance. Some of the main metrics for object detection algorithms include:
-
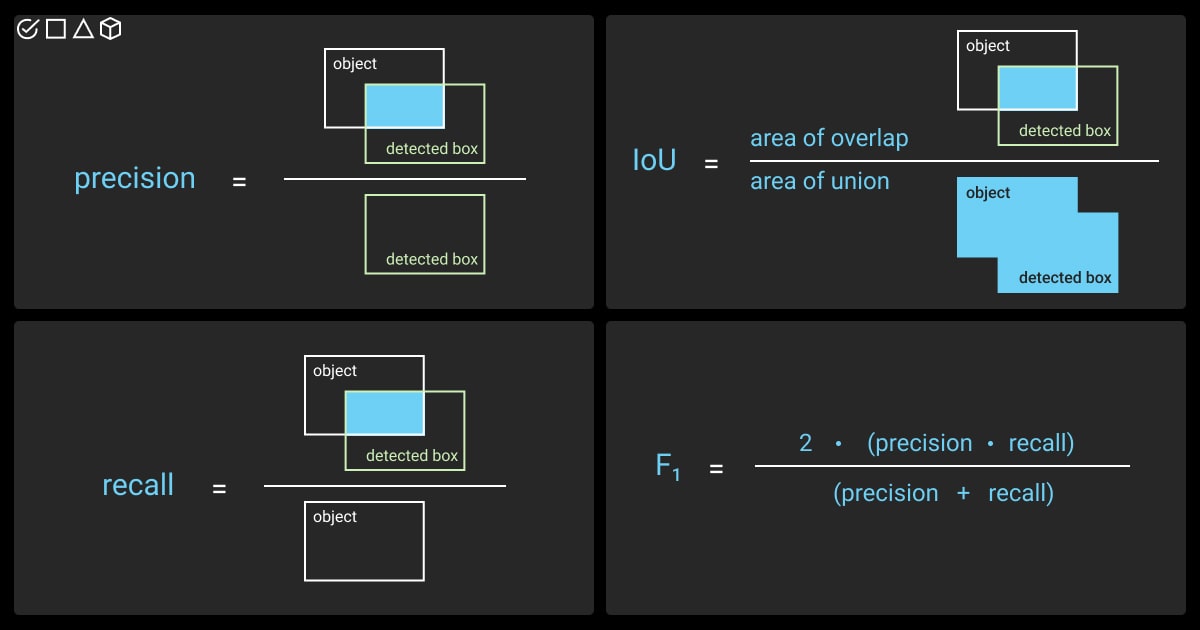
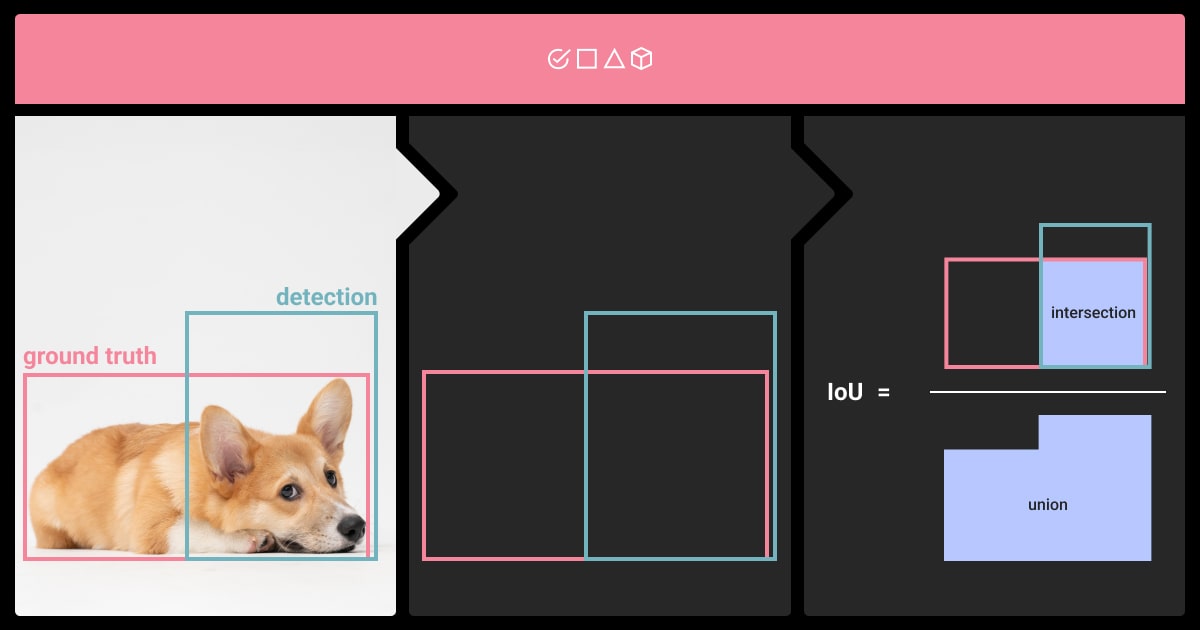
Intersection over Union (IoU)
An accuracy metric, IoU assesses the intersection of two bounding boxes (the predicted one and ground truth box). The metric derived from the Jaccard Index.
-
Precision and Recall
While precision focuses on accurately identifying relevant objects, recall emphasizes the model’s capability to find all ground truth bounding boxes. Together, precision and recall weigh the balance between prediction quality and quantity.
-
Average Precision (AP)
AP stands as the fundamental metric for object detection, which integrates precision, recall, and the model’s confidence in each detection. Calculated separately for each class, average precision object detection condenses the Precision x Recall curve into a single numerical summary.
-
Mean Average Precision (mAP)
Mean Average Precision (mAP) builds on the idea of AP, specifically in multi-class scenarios. It is computed by averaging the AP across all classes. The metric considers precision and recall for various IoU thresholds and object classes, with a higher mAP indicating superior overall model performance.
-
F1 Score
F1 represents a trade-off between precision and recall, calculated as their harmonic mean.
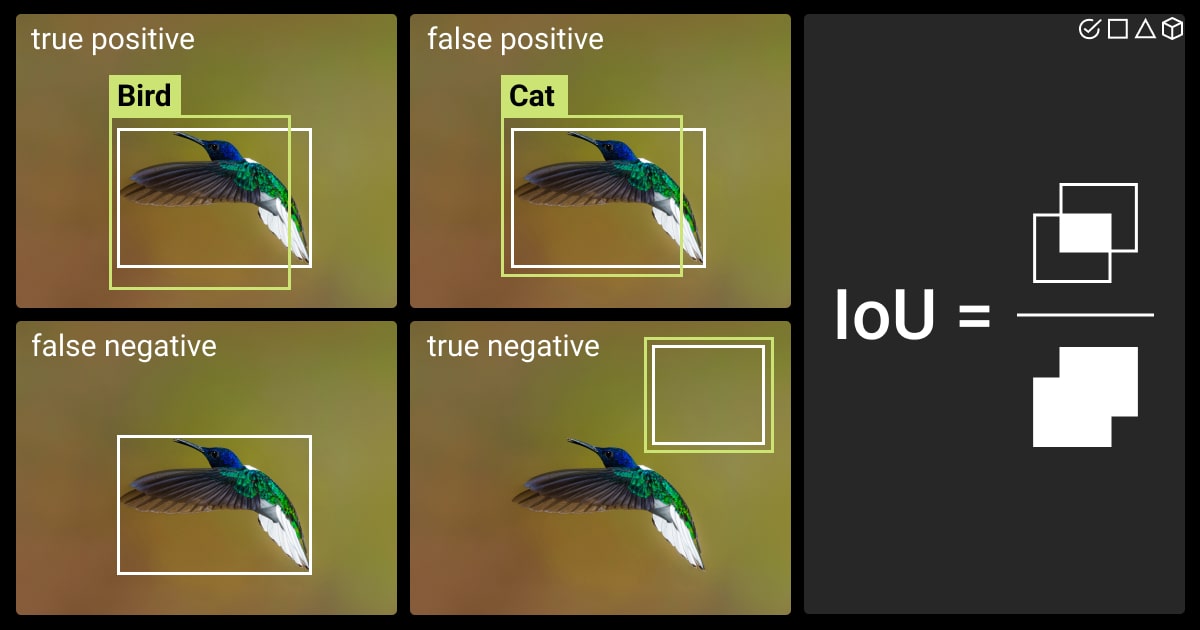
Before delving deeper into these metrics, let’s clarify some fundamental concepts used by these metrics for assessing object detection algorithms. These are confusion matrix elements used to assess the performance of object detection models:
True Positive (TP) |
An accurate detection where the object detection model correctly recognizes and locates objects, with the IoU score between the predicted bounding box and the ground truth bounding box meeting or exceeding a predetermined threshold. |
False Positive (FP) |
An inaccurate detection, when the model mistakenly identifies an object that is not present in the ground truth or when the predicted bounding box has an IoU score below the specified threshold. |
False Negative (FN) |
Failure to detect ground truth, when the model doesn’t identify an object present in the ground truth, essentially indicating that it overlooks these objects. |
True Negative (TN) |
Not used in object detection because it focuses on accurately confirming the absence of objects. Our goal is to spot and identify objects rather than verifying their absence. |
*threshold: typically set at 50%, 75%, or 95%, depending on the metric.
Threshold values are often determined based on the confidence scores assigned to the model’s predictions. They represent a confidence level used to classify a detected object as a positive prediction. Adjusting the threshold allows control over the balance between precision and recall.
To sum up, all the above-mentioned terms are typically used to compute basic object detection metrics such as precision, recall, F1 score, and IoU. Precision, recall, and F1 score are calculated based on the number of TPs, FPs, and FNs. IoU is a measure of the overlap between the predicted and ground truth bounding boxes and is typically used to determine whether a detection is considered a true positive.
Comparing the Most Popular Object Detection Metrics
The evaluation of performance metrics on object detection algorithms is crucial for computer vision. In this section, we’ll discuss the metrics used by the most popular competitions of object detection, including COCO Detection Challenge, VOC Challenge, Google AI Open Images challenge, Open Images RVC, Lyft 3D Object Detection for Autonomous Vehicles, and City Intelligence Hackathon.
Metric |
Pros |
Cons |
Intersection over Union (IoU) |
|
|
Precision and Recall |
|
|
Average Precision (AP) |
|
|
Mean Average Precision (mAP) |
|
|
F1 Score |
|
|
In the end, the metric you go with for your model should reflect the specific needs or preferences of your computer vision task. You can also consult with our Annotation Lead to find the best computer vision service for your project!
How to Choose Among the Best Metrics for Object Detection?
To choose the most optimal metric for your object detection algorithm, it’s important to define your project goals first and understand the data you work with. Then, you can compare the metrics for their alignment with your goals and assess their impact on model training and testing.
Ultimately, you might consider using multiple metrics for a comprehensive evaluation of an object detection model. Besides, for better analysis of high-performing models, use both the validation dataset (for hyperparameter tuning) and the test dataset (for assessing fully-trained model performance).
Tips for the validation dataset:
Use mAP to identify the most stable and consistent model across iterations.
Check class-level AP values for model stability across different classes.
Go for mAP to assess whether additional training or tuning is necessary for the model.
Tailor model training/tuning based on tolerance to false negatives (Precision) or false positives (Recall) according to your use case.
Tips for the test dataset:
Evaluate the best model with F1 score if you’re neutral towards false positives and false negatives.
Prioritize Precision if false positives are unacceptable.
Prioritize Recall if false negatives are unacceptable.
After selecting the metric, experiment with various confidence thresholds to find the optimal value for your chosen metric. Determine acceptable trade-off ranges and apply the selected confidence threshold to compare different models and identify the best performer.
How to Incorporate Performance Metrics for Object Detection?
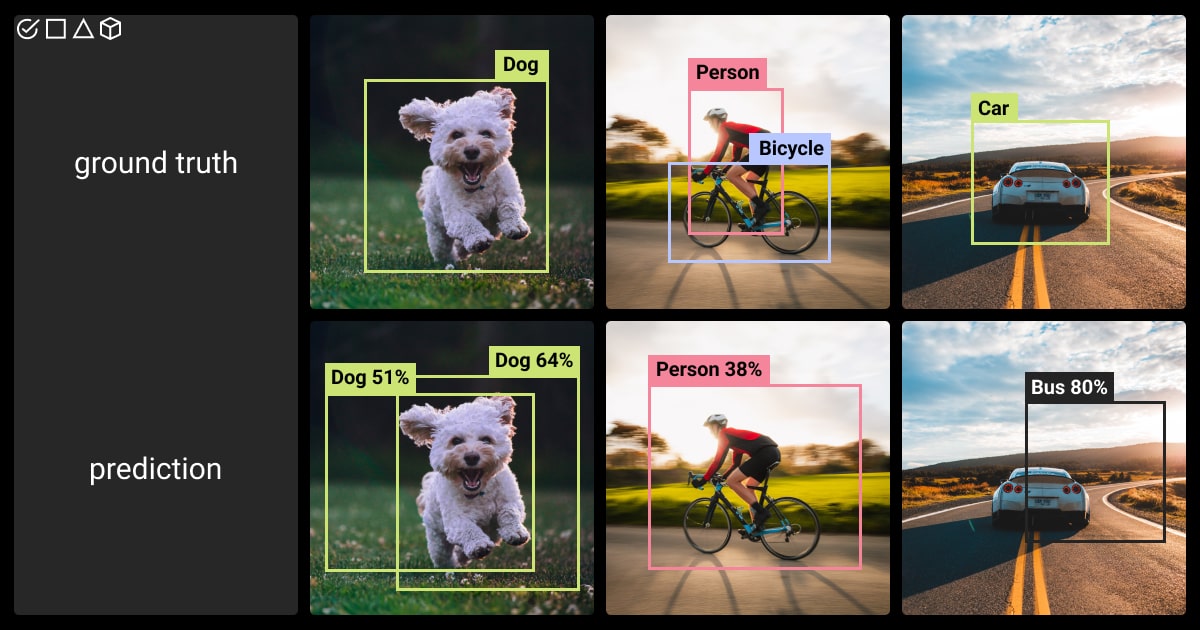
Object detectors aim to accurately predict the location of objects in images or videos, achieved by assigning bounding boxes to identify object positions. Each detection is characterized by three attributes:
Object class;
Corresponding bounding box;
Confidence score, ranging from 0 to 1.
The assessment involves comparing ground-truth bounding boxes (representing object locations) with model predictions, each comprising a bounding box, class, and confidence value.
To implement and visualize metrics for object detection model evaluation and improvement, consider tools like the TensorFlow Object Detection API. It provides pre-trained models, datasets, and metrics. This framework supports model training, evaluation, and visualization using TensorBoard.
The COCO Evaluation API offers standard metrics (e.g., mAP, IoU, precision-recall curves) for object detection models evaluation on the COCO dataset or custom datasets. Additionally, Scikit-learn, a library for machine learning, provides various metrics and functions for calculation and visualization.
TL;DR: Object Detection Metrics in a Nutshell
Let’s summarize the key points of this article about object detection evaluation metrics:
Intersection over Union (IoU), Precision and Recall, F1-Score, Average Precision, and Mean Average Precision (mAP) — are the foundation for assessing computer vision models.
IoU is particularly crucial in tasks such as object detection and segmentation.
Precision and Recall offer insights into accurate positive predictions and comprehensive object capture, with the F1-Score striking a balance between them.
Mean Average Precision (mAP) provides a comprehensive overview of model performance, considering precision and recall trade-offs.
Ready to conquer the computer vision domain? Get your custom datasets for ML model training from our annotation experts at Label Your Data!
FAQ
What is the evaluation metric for object detection models?
The evaluation metrics for object detection model assess its ability to accurately identify and locate objects in an image. It’s typically measured through metrics like Average Precision (AP) or mAP (mean Average Precision), which consider the precision and recall of the model across different object categories and detection thresholds.
How do you measure the performance of an object detection model?
The performance of an object detection model is evaluated using metrics such as Average Precision (AP), precision-recall curve, F1 score, as well as the mean average precision (mAP) across different object categories.
What metrics to use to evaluate deep learning object detectors?
In the assessment of a DL object detector’s performance, we rely on two key evaluation metrics. The first is FPS (frame-per-second), which quantifies the network detection speed. The second is mAP (mean Average Precision), a metric used to measure the network precision.
Table of Contents
![]() Get Notified ⤵
Get Notified ⤵
Receive weekly email each time we publish something new: