Mean Average Precision: Is It the Same as Average Precision?

 CEO of Label Your Data
Table of Contents

TL;DR
- What is mAP? An essential metric for evaluating the performance of object detection models.
- How mAP Works: It combines precision and recall across thresholds to provide an overall performance score for object localization and classification.
- Key Metrics Used: Confusion matrix, Intersection over Union (IoU), precision, and recall.
- Practical Use Cases: From tumor detection in medical imaging to quality control in manufacturing, mAP helps validate model accuracy in diverse applications.
- Why mAP Matters: By using mAP, teams can directly compare models and select the best-performing one for their object detection tasks.
What Is Mean Average Precision (mAP) for an Object Detection Model?
Most people mistakenly assume that mean average precision, or simply mAP, is directly related to the average of precision. Although it seems quite logical, in practice it is not the case. The underlying principle of mAP is far more complex.
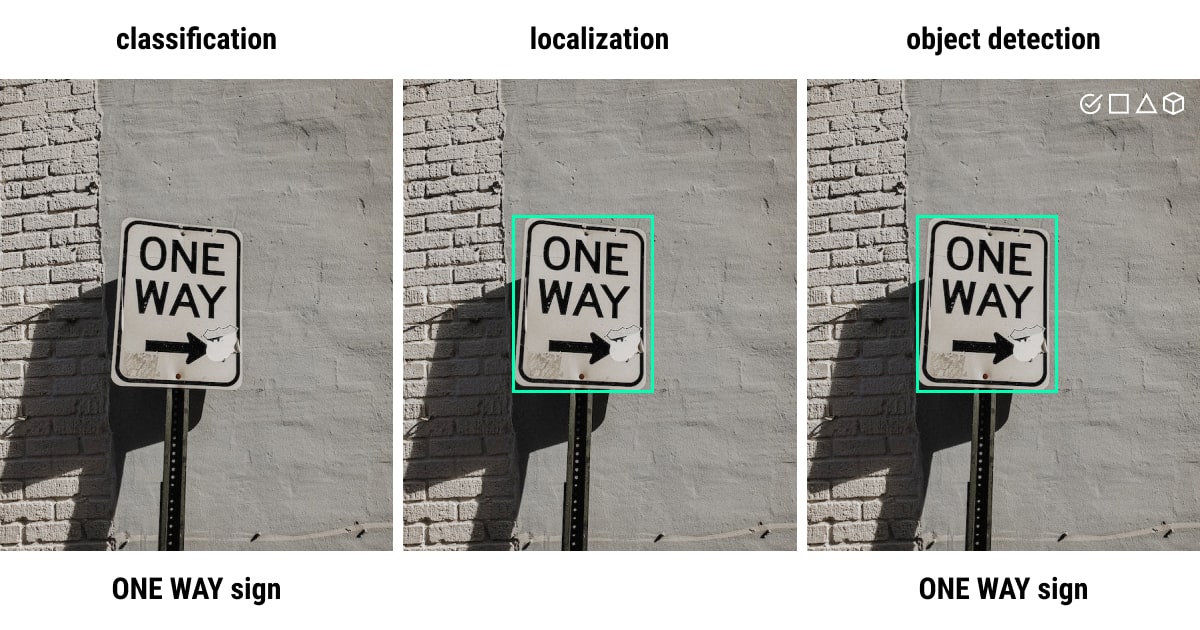
Mean average precision for object detection (i.e., localization and classification tasks) is one of the commonly used evaluation metrics in computer vision (CV). Localization pinpoints an object’s position using (e.g., bounding box coordinates), and classification identifies it (whether it’s a dog or a cat). Therefore, the performance of object detection algorithms, segmentation systems, and information retrieval tasks, is frequently examined using the mAP metric.
Why mAP Matters for Object Detection Models
Many object detection models require mean average precision to assess their performance before releasing the final results, including Faster R-CNN, MobileNet SSD, and YOLO. A number of benchmark tasks, including Pascal, VOC, COCO, and others, also make use of the mAP.
More specifically, recall values between 0 and 1 are used to determine the average precision (AP) values. Check this mean average precision formula to get a better idea of this metric in data annotation:
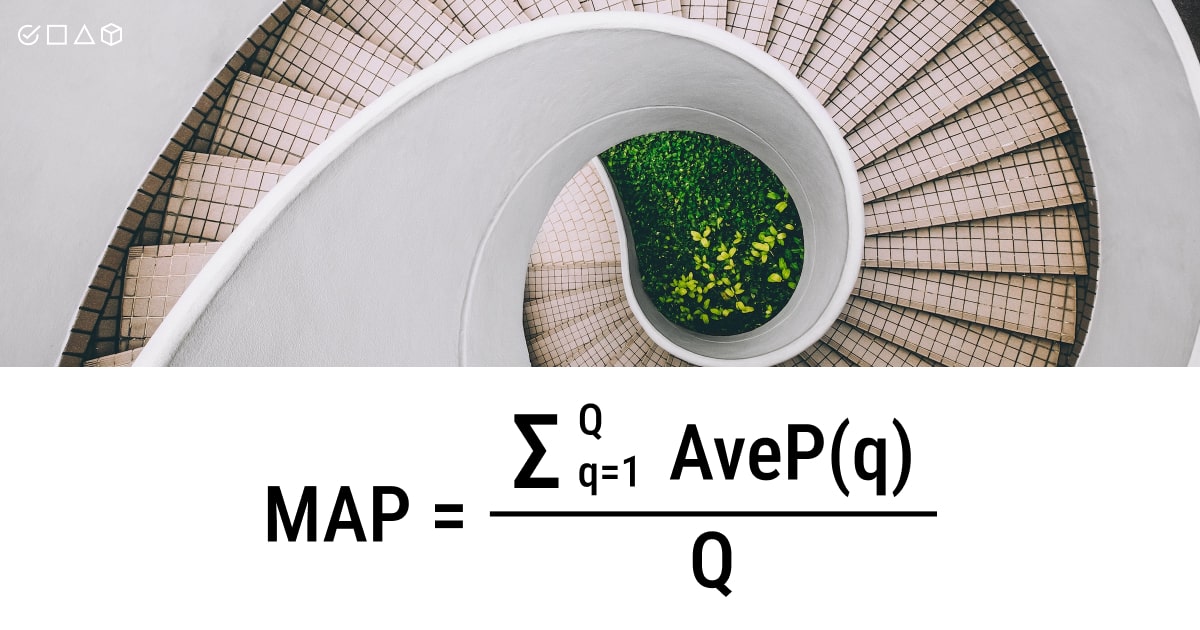
- Q is the total number of queries in the set
- AveP(q) is the average precision (AP) for a given query Q
For a particular query (Q), we compute its associated average precision (AP). The mean of all these AP scores would give us a single value, termed the mean average precision (mAP), which quantifies how well our model performs the query. This is basically what the mAP formula is all about.
The following sub-metrics form the backbone of the formula for the ultimate mAP accuracy:
- Confusion Matrix
- Intersection over Union(IoU)
- Recall
- Precision
When talking about object detection, what we mean by that is essentially the task of identifying target objects in the images or videos and classifying them into relevant classes, using machine learning or deep learning techniques. More about the distinction between these concepts you can find in our article about image classification vs. object detection.
A good object detection example for mAP calculation would be tumor detection in medical images. But first, you need image annotation services to get training data for an object detection model (of your choice) to recognize tumors and classify them automatically and accurately.
But now the question: how do we decide which model works best for a given task? Having the opportunity to directly measure how each model performs across images in our test set, across classes, and at various confidence criteria would be truly helpful. Here’s where the mAP metric comes into play. However, we must first spend some time studying the precision-recall curve to comprehend the mean average precision object detection.
The Precision-Recall Curve in Machine Learning mAP
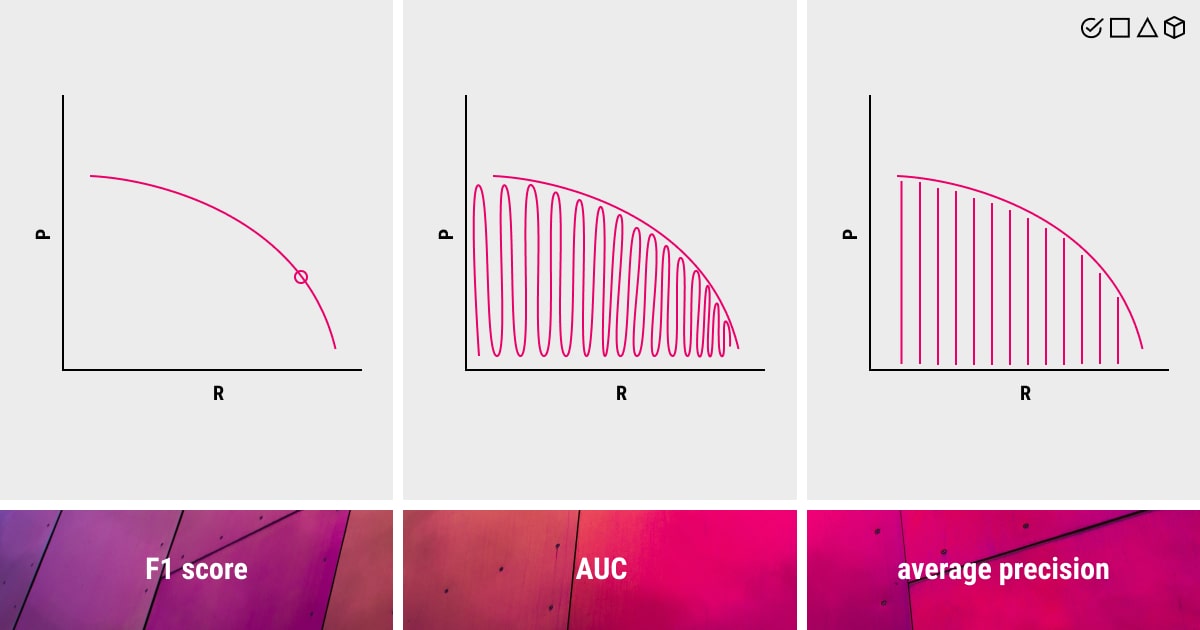
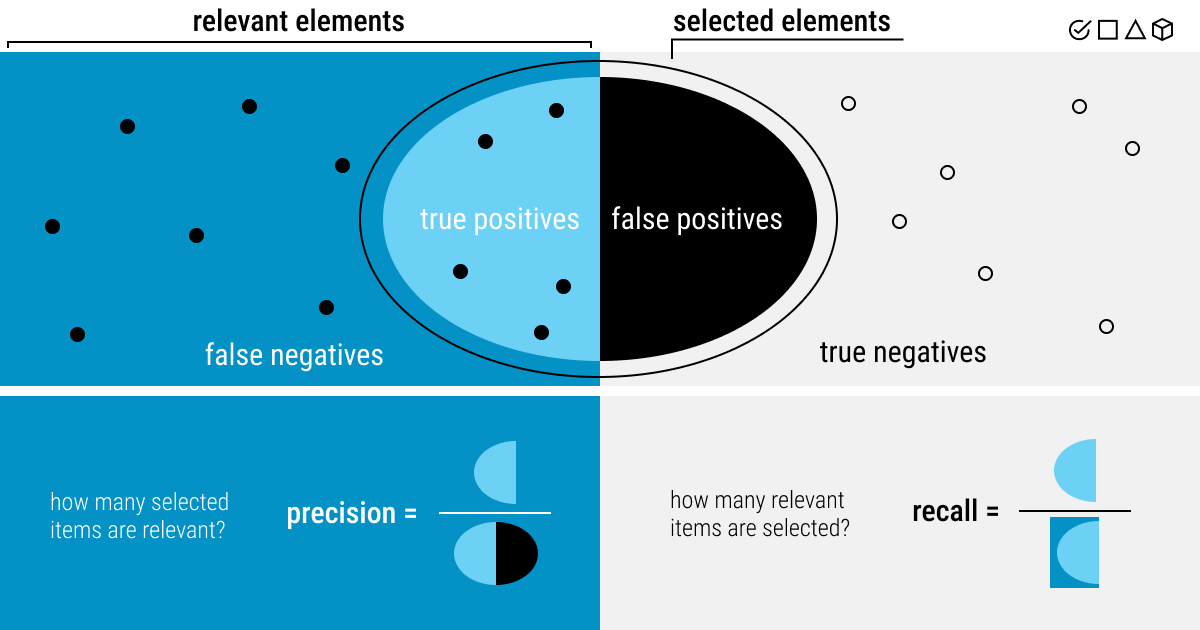
When the classes are severely unbalanced, precision-recall is a helpful indicator of prediction success. Precision in information retrieval refers to how relevant the results are, whereas recall measures the number of outcomes that are actually relevant.
Examining the trade-off between precision and recall values at various thresholds is important due to the role of both of these metrics. This curve helps choose the ideal threshold to optimize both metrics. High recall and high precision are both represented by a high area under the curve, where high accuracy is correlated with a low false positive rate and high recall is correlated with a low false negative rate. High scores for both indicate that the classifier is producing results with high accuracy and a high percentage of good findings (high recall).
The precision-recall curve requires the following inputs to be created:
- The ground-truth labels.
- The prediction scores of the samples.
- A few thresholds to turn the prediction scores into class labels.
The majority of the suggested labels from a system with high recall but low accuracy are inaccurate when compared to the training labels. The reverse is true for a system that has high recall but low accuracy: it produces very few results, yet most of the labels match the training labels. The ideal system will provide numerous results, all of which will be accurately categorized, and have a high recall and accuracy.
How do you get the precision-recall curve? You may get it by graphing the accuracy and recall values of the model as a function of the model’s confidence score threshold. In this case, precision is associated with correct prediction and shows to what extent the model’s positive predictions may be trusted. Recall, in turn, measures the model’s capacity to identify positive samples and demonstrates any predictions that a model shouldn’t have missed.
Important note: precision and recall cannot be used independently of one another, which is why we use a curve.
The reason for this is simple. When there’s a high recall but low accuracy, your model produces many false positives (negative samples are categorized as positive), even though it classifies the positive samples correctly. Conversely, with high accuracy but low recall, your model is only accurate when classifying samples as positive; but it might do so with only some of the positive samples.
To sum up, the precision-recall curve captures the trade-off between the two criteria and maximizes their combined impact. As a result, we get a clearer picture of the model’s overall accuracy in performing object detection. Such a curve is commonly used in binary classification to analyze the output of a given classifier.
Mean Average Precision Explained through The Key Metrics
As we’ve mentioned above, there are certain metrics and sub-metrics of mAP that form the basis of this evaluation metric used in machine vision, as part of a more general concept known as perception in machine learning. They include confusion matrix, Intersection over Union(IoU), recall, and precision.
First, you need to create a confusion matrix. Here are some important components that will help you accomplish this task (hint: we’ve mentioned them in the precision-recall curve):
True positives (Tp)
The model properly predicted a label and matched the ground truth (i.e., the accuracy of the training set’s classification). The model has detected the right type of object and its correct location.
True negatives (Tn)
The model is not a part of the ground truth, and neither does it forecast the label. The model has correctly predicted the wrong class.
False positives (Fp)
A label was predicted by the model, however, it is not a part of the ground truth. The model has detected an object that is not there or provided a wrong label.
False negatives (Fn)
A label is not predicted by the model, but it is a component of the ground truth. The model has not detected the object.
Second, the concept of Intersection over Union(IoU) describes the relationship between the expected bounding box coordinates and the actual box. Higher IoU implies a closer match between the anticipated and actual bounding box coordinates. Basically, you measure the correctness with IoU.
After our model has produced its predictions, we examine each one and give it one of the aforementioned labels. This allows us to measure precision and recall. The formulas for both (and more) are as follows:
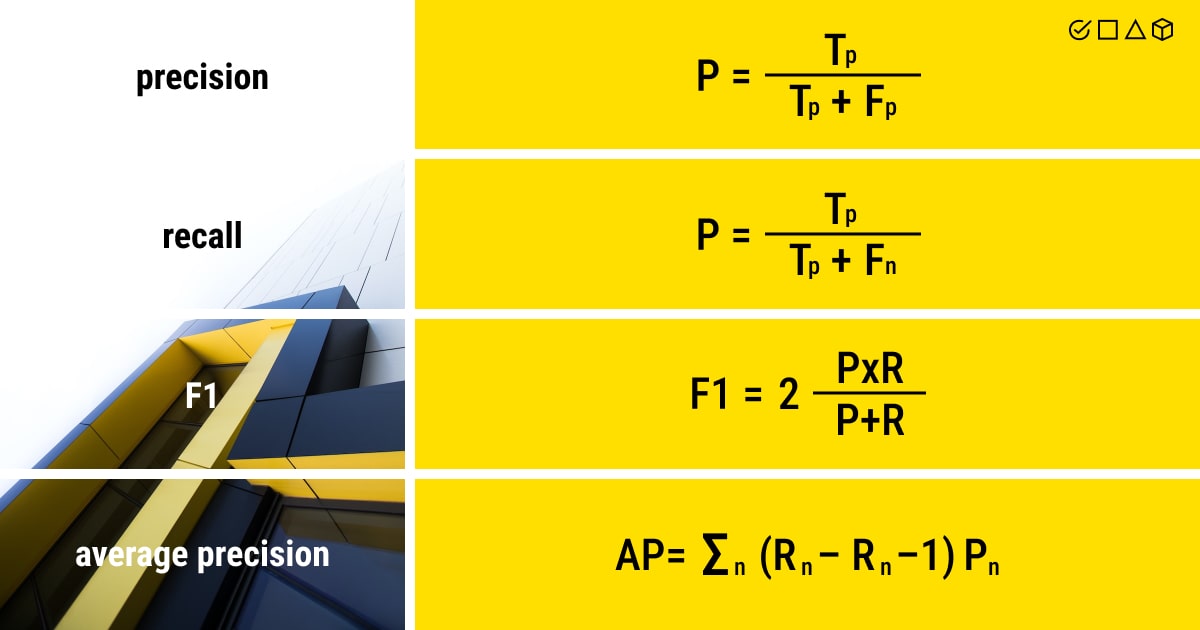
- Precision is viewed as the number of true positives (Tp) over the number of Tp plus the number of false positives (Fp);
- Recall is seen as the number of Tp over the number of Tp plus the number of false negatives (Fn).
- F1 score is the harmonic mean of both precision and recall.
- Average precision (AP) calculates the weighted average of precision at each threshold, with the increase in recall from the preceding threshold serving as the weight.
Despite first appearing random, these formulas make a lot of sense. In a nutshell, recall and precision provide crucial insights into the object detection model performance. With precision, we can better understand how many correct predictions are out of all the results. Recall reveals how many examples of a given class in the ML dataset has the model discovered. This is exactly how you can get a complete view of the model’s performance.
In reality, both precision and recall are applied in a wide range of cases and are not restricted to object detection or even computer vision.
Key metrics ensure the model performs well. But the most crucial aspect here is how well the data is prepared for the model training.
How to Calculate mAP to Assess an Object Detection Model’s Performance?
Now it’s time to summarize all the gained knowledge and proceed with the actual calculations to evaluate the mAP of the object detection model.
The weighted mean of precision at each threshold is used to determine the average precision score (AP), while the weight itself represents the increase in recall from the previous threshold. Therefore, the average of AP of each class is known as the mean average precision (mAP). However, the meaning of AP and mAP vary depending on the context. For example, AP and mAP are equivalent in the evaluation report for the COCO object detection task.
We have compiled all the necessary steps you need to take to measure mean average precision object detection into one list, so you can better process and structure all the information we provided in this article:
- Using the model, provide the prediction scores.
- Create class labels by converting the prediction scores.
- Calculate the confusion matrix, including Tp, Tn, Fp, and Fn.
- Measure the precision and recall metrics for different IoU thresholds.
- Plot them against each other.
- Do the calculations of the area under the precision-recall curve.
- Measure the average precision score (AP).
- Calculate the mAP by using AP for each class and the average over a number of classes.
How to Apply Mean Average Precision for Object Detection?
Object detection seems an easy CV task at first sight: you have a labeled training dataset and a model to train it with. However, once your model is trained, you spend hours evaluating its performance to make sure you get accurate and credible results. Evaluations and tons of metrics might leave you frustrated in the end because the expectations were not met.
For instance, in geospatial data annotation services, object detection helps outline and identify specific regions of interest within satellite or aerial imagery. In manufacturing, it helps with quality control and defect detection tasks for efficient and accurate inspection of products on production lines. Amidst these diverse applications, navigating through evaluations and numerous metrics may leave you frustrated if expectations are not met.
Similarly, LLM fine-tuning requires precise evaluation metrics to ensure models deliver accurate, contextually relevant outputs. This underscores the importance of metrics like mAP in object detection applications.
In this case, you need to master only one metric to benchmark model performance, that is mAP. Mean average precision (mAP) for an object detection model is a common metric used for assessing its precision, and it has gained traction in machine learning and deep learning. Yet, it’s still difficult to disentangle errors in object detection and instance segmentation from mAP.
About Label Your Data
If you choose to delegate data annotation, run a free data pilot with Label Your Data. Our outsourcing strategy has helped many companies scale their ML projects. Here’s why:
Rely on consistent, high-quality output for complex datasets, detailed taxonomies, and edge cases.
Get quality engineered into every step through onboarding, evolving guidelines, QA, and continuous feedback.
Adjust team capacity, project size, and delivery model as you scale, with no setup fees or long-term lock-ins.
Align on goals, workflows, and expectations with a team that integrates into your process from day one.
Work with former annotators who understand annotation complexity, quality standards, and high-volume delivery.
FAQ
How is mean average precision computed for object detection?
mAP (mean average precision) for object detection is computed by taking the mean AP over all classes and/or overall IoU thresholds, where AP is the area under the precision-recall curve.
What is mean average precision in OpenCV?
Mean average precision (mAP) in OpenCV (aka Open Computer Vision Library) is a performance metric used for evaluating machine learning models. OpenCV provides functions to compute mAP, making it a useful tool for assessing the effectiveness of object detection algorithms.
Can mean average precision be greater than 1?
No, mean average precision (mAP) cannot be greater than 1, as it is a normalized metric typically ranging from 0 to 1 (i.e., between 0 – 1 0–1 0–1), representing the average precision (AP) values across different classes.
Written by
CEO of Label Your Data
Karyna is the CEO of Label Your Data, a company specializing in data labeling solutions for machine learning projects. With a strong background in machine learning, she frequently collaborates with editors to share her expertise through articles, whitepapers, and presentations.