


 Back to blog
Overfitting vs Underfitting: ML Model Fit Explained

 CEO of Label Your Data


Table of Contents

- TL;DR
- Overfitting vs Underfitting: The Key Differences
- How to Detect Overfitting vs Underfitting During Training
- Techniques to Fix Overfitting vs Underfitting in ML
- How to Balance Model Underfitting vs Overfitting
- How Better Training Data Prevents Overfitting vs Underfitting
- About Label Your Data
- FAQ

TL;DR
- Overfitting occurs when a model memorizes training noise and fails on new inputs, while underfitting happens when a model is too simple to capture real patterns.
- You need to balance model complexity, tune hyperparameters, and manage training duration to get the right overfitting vs underfitting fit.
- Practical methods like early stopping, dropout layers, feature engineering, and proper scaling stabilize model performance across both ends of the fit spectrum.
- Algorithmic tweaks adjust how your model learns, but eliminating label noise and filling edge-case gaps with high-quality data annotation fixes fit problems at the root.
You’ve probably deployed a model that scored well in training and collapsed on real-world edge cases.
A 2025 study introduced the Overfitting-Underfitting Indicator (OUI) to measure this dynamic. Training DenseNet-BC-100 on CIFAR-100, weak regularization held OUI near 0.9 and top-1 accuracy at 75.64%. Too much pushed OUI below 0.6 and accuracy down to 65.93%. The balanced runs, with OUI around 0.7, reached 79.54%.
A model can fail because it learns too much from its training data, or because it doesn’t learn enough from it. The goal is to find the right overfitting vs underfitting balance, and the rest of this article covers how to spot which way your model is leaning and what to change when it is.
Overfitting vs Underfitting: The Key Differences
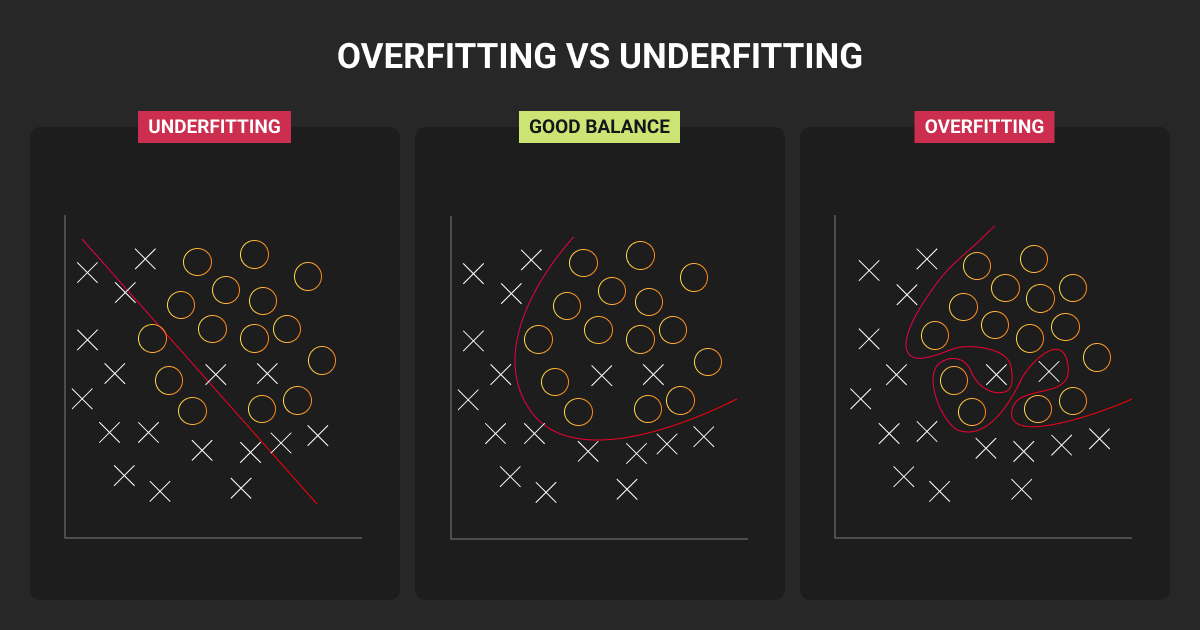
Both overfitting vs underfitting in machine learning have the same root cause — a mismatch between model complexity and what the data can actually support.
Before restructuring your data pipeline or data annotation pricing to fix overfitting or underfitting, it helps to separate them clearly:
| Behavior | Underfitting | Overfitting |
| Training error | High | Very Low |
| Testing error | High | High |
| Model complexity | Low | High |
| Bias vs. variance | High bias, low variance | Low bias, high variance |
| Data fit | Fails to capture real patterns | Memorizes training noise |
| Predictions | Poor accuracy on all data | Accurate on train data, poor on test data |
What is overfitting?
Overfitting is when a model performs well on training data but poorly on data it hasn’t seen, such as a held-out test set, or anything new in production. The model has essentially memorized the training set instead of learning patterns that generalize.
Overfitting is one of the main causes of high generalization error. If your model underperforms in production, overfitting is one of the first things worth checking.

Random data splits can be deceptive. We thought we had an overfitting problem, but it was just duplicate tickets showing up across splits and messing up the numbers. Before anyone starts tweaking model architecture, I'll tell them to double-check their data splits for any leakage. Fix the data first, not the model.

 CTO, AGO
What is underfitting?
Underfitting is when a model fails to capture the underlying pattern in the data. It performs poorly on training data and just as poorly on test data, because it never learned enough in the first place.
Model underfitting usually means it doesn’t have enough capacity, or wasn’t trained long enough. No matter how much you tweak it, performance plateaus early. And this is a sign the model hasn’t grasped even the basics of the task.
This video breaks down overfitting vs underfitting in more detail.
How to Detect Overfitting vs Underfitting During Training
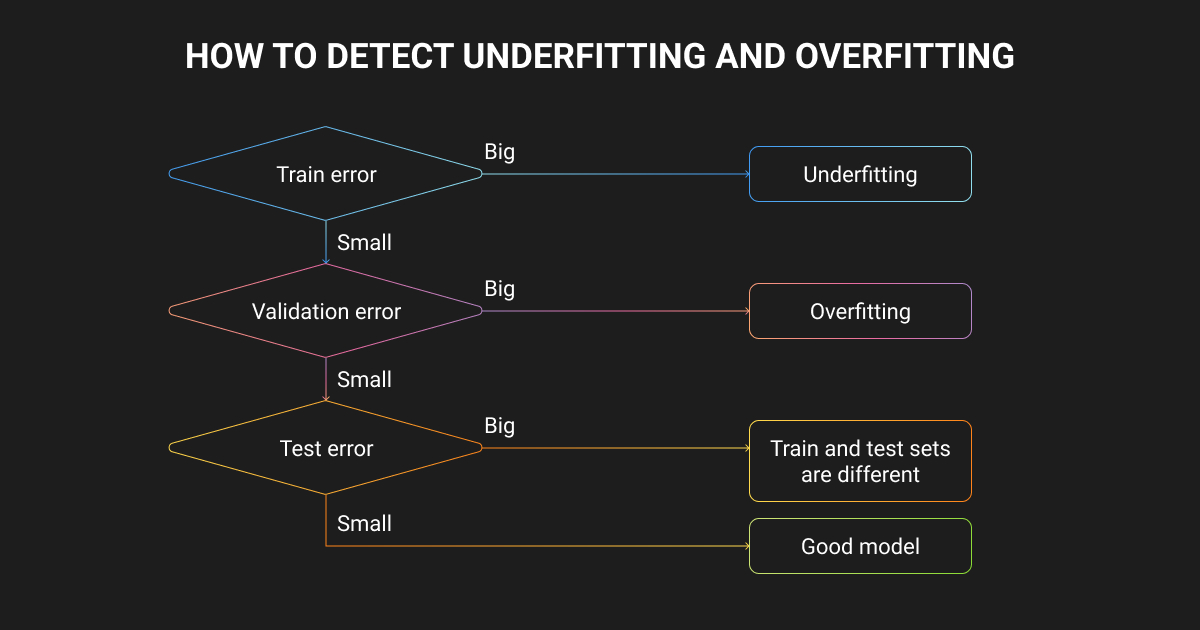
To spot model fit issues early you need to monitor both numerical metrics (training and testing error) and diagnostic plots (learning curves).
Depending on whether your model suffers from high variance or high bias in machine learning, the training and testing error curves show different patterns.
Signs your model is overfitting
- The metric gap: Training error drops while validation error stays high or increases, which signals the model has stopped generalizing.
- High cross-validation variance: Test scores swing wildly depending on which data chunk the model evaluates.
- Learning curves (Epochs): On an overfitting vs underfitting graph, overfitting starts where training loss keeps falling but validation loss turns upward.
- Validation curves (Capacity): On an overfitting vs underfitting curve, plot accuracy against model depth or parameter count, and watch for a peak followed by decline.
Signs your model is underfitting
- High error everywhere: Training loss and test loss both stay high, meaning the model is too simple to capture the underlying patterns.
- Low accuracy ceiling: Training score hits a hard wall early and refuses to improve, even with more training time.
- Small metric gap: Training and test score are very close to each other, but both are unacceptably low.
- Flat learning curves: Training loss and validation loss flatten out quickly at a high error rate. The two curves stay close together, showing no signs of divergence.
- Under-capacity validation curves: On a hyperparameter plot, performance stays low at low depth or complexity until you increase model capacity.
Techniques to Fix Overfitting vs Underfitting in ML
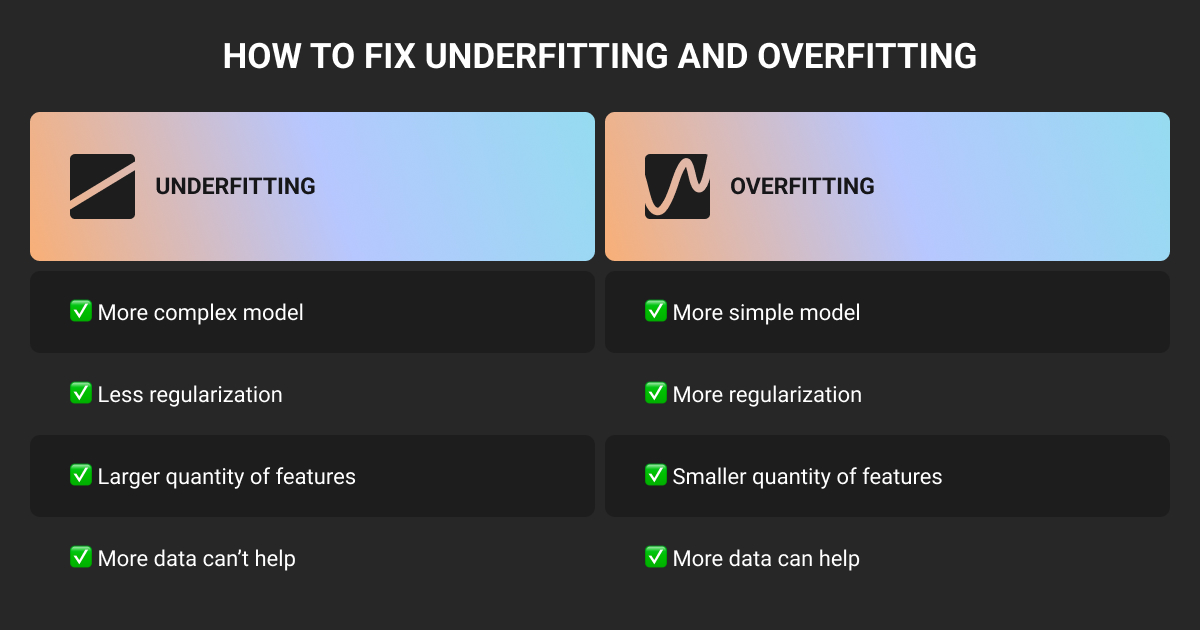
High variance (overfitting) and high bias (underfitting) call for opposite fixes, so match the technique to what your curves showed:
| Aspect | Fix overfitting | Fix underfitting |
| Model capacity | Use ensemble methods (Bagging or Boosting) to smooth out individual model errors. | Increase complexity by adding network layers, neurons, or switching to non-linear algorithms. |
| Training duration | Stop early the moment validation metrics degrade to avoid learning noise. | Extend training across more epochs and increase early stopping patience to allow full convergence. |
| Feature set | Prune low-value inputs to force the model to focus only on strong, primary signals. | Add engineered features or new domain variables to supply missing data signals. |
| Data inputs | Augment data with flips, crops, or pitch shifts so samples never look identical. | Scale numerical features to a uniform range so gradient descent updates weights smoothly. |
| Neural structure | Apply dropout to deactivate random nodes, forcing balanced feature pathways. | Reduce structural penalties to give parameter weights room to fit real trends. |
These levers all adjust how the model learns. When none of them move the curve, the constraint is usually the data itself.
How to Balance Model Underfitting vs Overfitting
If you visualize model performance on an overfitting vs underfitting diagram, the sweet spot happens at the exact point where a model is complex enough to capture true signals, but simple enough to ignore noise.
Choose moderate model complexity
Matching model capacity to problem difficulty prevents extreme model fit errors.
It’s good to start with a simple baseline model for a clear performance benchmark. From there, you can gradually increase model depth or combine architectural scaling with managed data annotation services until test performance reaches its peak.
Apply regularization
Regularization keeps your model weights small during training. The two main types, L1 and L2, do this in different ways:
- L1 (Lasso): Multiplies absolute weight values by a penalty, driving useless feature weights straight to zero.
- L2 (Ridge): Penalizes squared weight values, which keeps parameters low without dropping them completely.
Let’s take stock market prediction models for example. Good regularization lets heavy hitters like earnings growth or trading volume drive the prediction, while heavily penalizing noisy variables like the day of the week.
Manage the training process
Controlling model training duration helps you ensure the optimization algorithm stops at peak performance. You track validation metrics at every epoch to catch the moment performance plateaus. Halting training at this exact threshold locks in optimal weights before overfitting sets in.
I check the data before I touch the model. Almost every overfitting problem people blame on architecture is actually a dataset that's too small, too repetitive, or leaking signal it shouldn't. Before changing anything structural, I check whether the performance gap shows up across data slices or just one, everywhere usually means the model, one slice usually means the data.
 Founder, Deep AI
How Better Training Data Prevents Overfitting vs Underfitting
Tuning hyperparameters and adjusting model architecture can only take you so far. At a certain point, your model performance hits a hard wall if the underlying training data is flawed.
High-quality data prevents overfitting vs underfitting problems before they start, since most fit issues trace back to problems in the data itself. As a specialist data annotation company, we at Label Your Data know that for sure.
Label noise causes overfitting
When training sets contain mislabeled samples or inconsistent tags, complex models work overtime to memorize those mistakes.
Every machine learning algorithm runs the risk of learning false patterns from bad labels, which tanks its performance on real-world test data. High-precision data annotation eliminates this noise, enabling the model to learn true patterns rather than human errors.
Missing edge cases cause underfitting
Models underfit when a machine learning dataset lacks enough diversity or detail to represent complex real-world scenarios.
If a dataset misses critical edge cases or subtle feature variations, the model remains overly simple because it lacks the information necessary to build accurate predictions. Expanding the dataset with rich, expertly annotated edge cases gives the model the coverage it needs to master nuanced real-world tasks.
Algorithmic tweaks adjust how a model learns, but custom, accurate training datasets dictate what it can learn. Working with a specialist AI training data provider therefore allows your team to fill critical gaps in training data, helping you avoid the overfitting vs underfitting problem entirely.
About Label Your Data
If you decide to delegate data annotation, start with a free data pilot from Label Your Data. Our outsourcing strategy has helped many companies scale their ML projects. Here’s why:
 Data Annotation for Complex Environments
Rely on consistent, high-quality output for complex datasets, detailed taxonomies, and edge cases.
 Structured Quality From Pilot to Production
Get quality engineered into every step through onboarding, evolving guidelines, QA, and continuous feedback.
 Flexible and Scalable Operations
Adjust team capacity, project size, and delivery model as you scale, with no setup fees or long-term lock-ins.
 An Integrated Delivery Partner
Align on goals, workflows, and expectations with a team that integrates into your process from day one.
 Projects Led by Annotation Experts
Work with former annotators who understand annotation complexity, quality standards, and high-volume delivery.
FAQ
What is overfitting vs underfitting?
Overfitting occurs when a machine learning model memorizes training noise and fails on new data. Underfitting occurs when a model is too simple to learn the underlying patterns in the first place.
What is an example of overfitting?
A classic example occurs in image recognition models trained to detect medical conditions, where a model accidentally learns to identify the hospital watermark in the corner of training X-rays instead of the actual pathology.
Is 99% accuracy overfitting?
Not necessarily, but if your model achieves 99% accuracy on training data and drops significantly on validation data, it’s definitely overfitting to ground-truth noise or memorizing artifacts.
What is the difference between overfitting and underfitting KNN?
In KNN (k-nearest neighbors), k is the number of neighbors the model checks before making a prediction. When k=1, the model overfits because the decision boundary clings to individual noisy data points. A very large k causes underfitting because the model averages over the entire dataset, washing away local patterns.
How do I know if my model is overfitting or underfitting?
Check your underfitting vs overfitting graph for loss trajectories. If training loss is low but validation loss is high, your model is overfitting. If both training and validation losses remain high, your model is underfitting.
Written by
CEO of Label Your Data
Karyna is the CEO of Label Your Data, a company specializing in data labeling solutions for machine learning projects. With a strong background in machine learning, she frequently collaborates with editors to share her expertise through articles, whitepapers, and presentations.