Wine Quality Prediction: Easy Steps with Machine Learning

 CEO of Label Your Data
Table of Contents
- TL;DR
- Why Wine Quality Prediction with Machine Learning Matters
- Dataset for Wine Quality Prediction
- Building a Wine Quality Prediction Model
- Improving Wine Quality Prediction Accuracy
- Tools and Frameworks for Wine Quality Prediction
- Practical Tips for Success
- Use Cases and Real-World Applications of Wine Quality Prediction
- About Label Your Data
- FAQ

TL;DR
- Machine learning predicts wine quality using data like acidity, sugar, and pH.
- Improves quality control, reduces costs, and provides consistent results.
- Prepare the dataset, choose algorithms (e.g., Random Forest, ANN), train and evaluate models.
- ANN (up to 88%), Random Forest (up to 88%), and SVM (up to 86.86%) perform best for wine quality prediction.
- Applications include automating wine evaluation, predicting consumer preferences, and optimizing production processes.
Why Wine Quality Prediction with Machine Learning Matters
Wine quality prediction using machine learning can save time and improve consistency in quality assessments. By analyzing features like acidity, sugar levels, and pH, you can build a model to predict how a wine will score.
In this guide, you’ll learn:
- Why predicting wine quality matters for production and quality control
- Steps to prepare your dataset and pick the right machine learning model
- Techniques to improve prediction accuracy with advanced methods
You don’t need to be an expert — just some basic knowledge of machine learning will do.
ML-powered wine quality evaluation offers clear advantages for winemakers and businesses. It transforms subjective quality checks into a data-driven process that’s faster and more reliable.
Benefits of Machine Learning for Wine Quality Prediction
- Consistency: Machine learning provides objective assessments, ensuring wines meet the same quality standards every time.
- Efficiency: Automating quality prediction reduces the time and cost of traditional sensory evaluations.
- Scalability: As wineries scale production, machine learning helps manage larger volumes of quality checks without added labor.
- Improved Decision-Making: Insights from data can guide winemakers in tweaking processes to enhance product quality.
Understanding Wine Quality Metrics
Wine quality is influenced by several measurable factors. Machine learning relies on these metrics to make predictions:
| Feature | Description |
| Fixed Acidity | Affects the wine’s tartness and overall balance. |
| Volatile Acidity | High levels give wine an unpleasant vinegar taste. |
| Citric Acid | Adds freshness and complexity to the flavor. |
| Residual Sugar | Determines the sweetness of the wine. |
| pH | Influences the perception of acidity. |
| Alcohol | Higher levels can contribute to the wine's body. |
By analyzing these features, machine learning can predict wine quality with greater precision, helping you streamline quality control processes.
Dataset for Wine Quality Prediction
The dataset is the backbone of your wine quality prediction model. It contains the information machine learning algorithms use to make predictions. Proper selection and preparation of the dataset are critical to your model’s success.
Where to Find Reliable Wine Datasets
A good wine quality dataset should be accurate, comprehensive, and relevant. For wine quality prediction, the most commonly used dataset is the UCI Wine Quality Dataset, which includes:
- Data for red and white wines
- 11 chemical properties as input features
- Quality ratings scored on a scale from 0 to 10
You can also explore:
- Kaggle: A hub for open-source datasets contributed by the ML community.
- Wine Research Centers: Industry organizations often release useful data.
Preparing the Dataset for Modeling
Preparation is as important as the data itself. Here’s how to make sure your dataset is ready for machine learning:
Understand the Data Columns
- Review each feature and understand what it represents.
- Drop irrelevant columns that don’t affect wine quality.
Clean the Data
- Fill Missing Values: Replace missing entries with averages or medians.
- Remove Duplicates: Check for and remove duplicate rows.
Handle Outliers
- Visualize features using histograms or box plots.
- Remove extreme outliers to avoid skewing predictions.
Balance the Data
- Check the distribution of wine quality scores.
- Use oversampling or undersampling to address class imbalance.
Feature Scaling
- Scale numerical data (e.g., alcohol levels) to bring all features to the same range.
- Standardization (mean=0, standard deviation=1) is commonly used.
If your dataset lacks quality labels, data annotation can help assign them based on expert input or defined criteria.
Feature Selection Tips
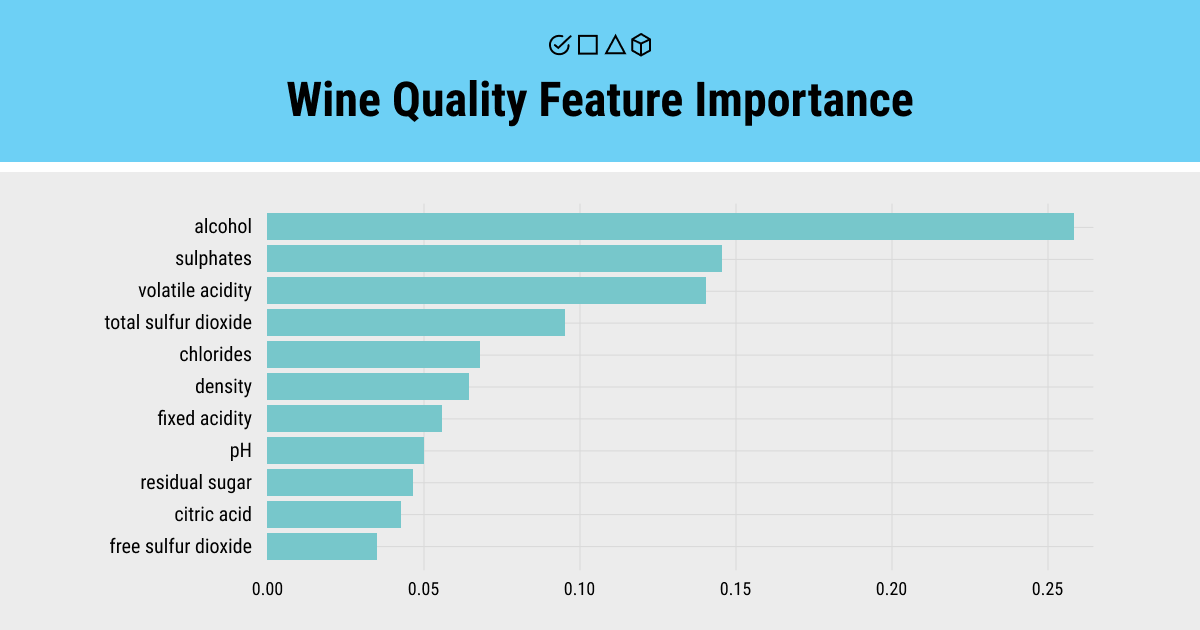
While the previous section listed all possible features, here are some tips on prioritizing the most impactful ones:
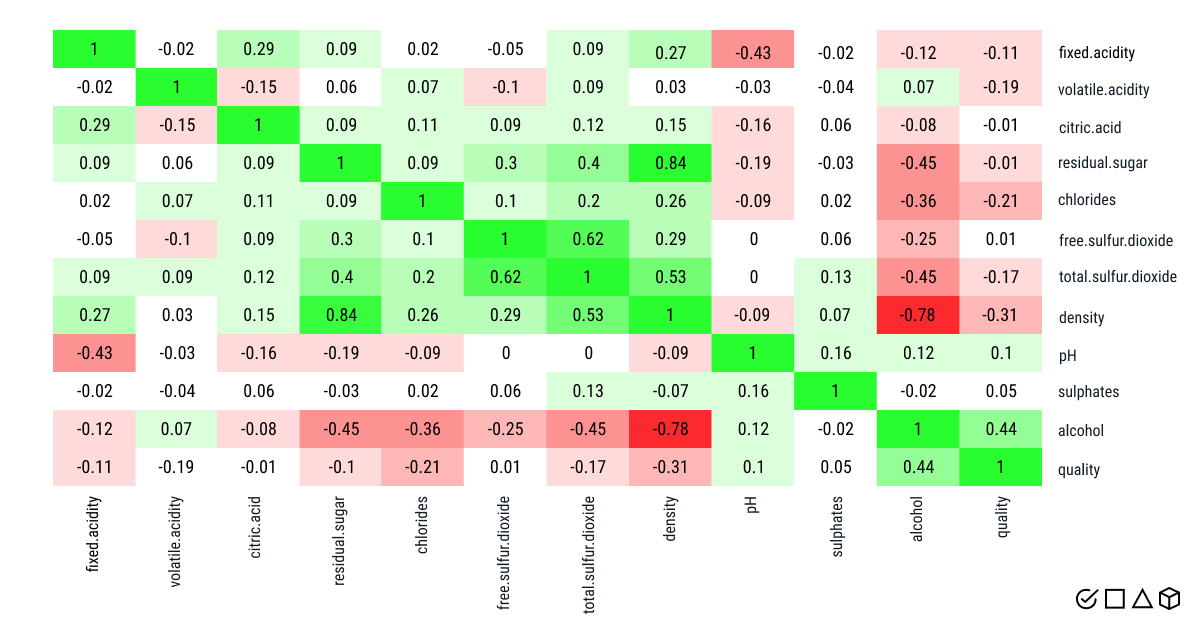
- Correlation Analysis: Use correlation heatmaps to identify features most related to wine quality.
- Domain Expertise: Consult wine professionals to understand which properties matter most (e.g., volatile acidity is key to taste).
- Feature Engineering: Combine existing features (e.g., acidity ratio) to create new, useful inputs.
Wine quality dataset analysis ensures your dataset is clean and optimized, you set a strong foundation for accurate predictions. Now you’re ready to start building your machine learning model.
Building a Wine Quality Prediction Model
Once your wine quality dataset is prepared, the next step is building a machine learning model. This involves selecting the right algorithm, splitting your data, training the model, and evaluating its performance. Let’s break this down into manageable steps.
Step 1: Choosing a Machine Learning Algorithm
The algorithm you choose depends on your goals and the complexity of your data. For wine quality prediction, some commonly used algorithms include:
- Linear Regression: A simple model for continuous predictions, but may struggle with complex relationships.
- Random Forest: Handles non-linear relationships and provides high accuracy.
- Gradient Boosting (e.g., XGBoost, LightGBM): Offers strong predictive power but requires parameter tuning.
- Neural Networks: Suitable for complex datasets but may require significant computational resources.
Tip: Start with simpler models like Random Forest and move to more advanced algorithms if needed.
Comparing ML Algorithms for Wine Quality Prediction
| Algorithm | Accuracy Range | Key Observations |
| Random Forest | 65.83% - 81.96% (up to 88%) | High accuracy, low error rate. Ideal for consistent results. |
| SVM | 57.29% - 67.25% (up to 86.86% on white wine) | Performs well but varies by dataset. Best for white wine. |
| ANN | 85.16% (red wine) - 88.28% (white wine) | Best accuracy for both red and white wine datasets. |
| Naïve Bayes | 46% - 55.91% | Limited accuracy. Not recommended for complex datasets. |
Step 2: Splitting the Dataset
To evaluate your model effectively, split your dataset into separate training and testing sets:
- Training Set (80%): Used to train the model.
- Testing Set (20%): Used to assess the model's performance on unseen data.
Alternative approach: Use k-fold cross-validation for a more robust evaluation. This splits the dataset into k subsets, trains on k-1 subsets, and tests on the remaining one, cycling through all subsets.
Step 3: Training the Model
Training involves feeding the algorithm with data and letting it learn patterns, like in image recognition. Here’s a high-level process:
- Input Features: Provide the cleaned and scaled dataset.
- Target Variable: Define wine quality scores as the target for prediction.
- Algorithm Parameters: Adjust parameters (e.g., tree depth for Random Forest) for initial training.
Step 4: Evaluating the Model
Evaluating the model ensures it performs well on new data. Key metrics for wine quality prediction include:
- Accuracy: Measures how often predictions are correct.
- Mean Squared Error (MSE): Evaluates how close predictions are to actual values (for regression).
- F1 Score: Balances precision and recall for imbalanced datasets.
By following these steps, you’ll have a working wine quality prediction model. In the next section, we’ll explore ways to improve its accuracy and performance.
Improving Wine Quality Prediction Accuracy
Once you have a basic model, the next step is to improve its accuracy and reliability. Small adjustments can make a significant difference in performance. Let’s look at key techniques to fine-tune your wine quality prediction model.
Feature Engineering
Feature engineering involves creating new inputs from existing data or improving the representation of your features.
- Combine Features: Create ratios or interactions between features, such as acidity ratio (fixed acidity/volatile acidity).
- Remove Irrelevant Features: Use correlation analysis to eliminate features with little impact on quality predictions.
- Add Derived Features: Use domain knowledge to engineer new features, such as sweetness levels from residual sugar and alcohol.
Hyperparameter Tuning
Algorithms like Random Forest or Gradient Boosting have hyperparameters that directly affect performance. Adjusting these can optimize the model.
Methods for tuning:
- GridSearchCV: Tests all combinations of hyperparameters.
- RandomSearchCV: Selects random combinations for faster results.
Key hyperparameters to adjust:
- Number of Trees (Random Forest): Higher values improve accuracy but increase training time.
- Learning Rate (Gradient Boosting): Balances speed and performance.
- Maximum Depth: Controls the complexity of decision trees to avoid overfitting.
Ensemble Methods
Ensemble methods combine multiple models to improve predictions:
- Bagging: Combines predictions from several models trained on different subsets of the data (e.g., Random Forest).
- Boosting: Sequentially trains models, correcting errors made by previous models (e.g., Gradient Boosting).
- Stacking: Combines predictions from multiple different models for improved accuracy.
Cross-Validation for Robust Results
Cross-validation ensures your model performs well across different data splits. Use k-fold cross-validation to test your model on multiple subsets of data and average the results for a more reliable evaluation.
Benefits of cross-validation:
- Reduces bias caused by a single train-test split.
- Gives a more accurate estimate of model performance on new data.
Testing with Real-World Data
Once your model is tuned, test it on data that closely resembles real-world conditions:
- Include unseen wines (not in your training dataset) to verify generalization.
- Evaluate its ability to correctly predict high and low-quality wines, especially if your dataset is imbalanced.
Improving model accuracy is an iterative process, just like with LLM fine tuning. Experimenting with features, parameters, and algorithms will gradually lead to better results.
Tools and Frameworks for Wine Quality Prediction
The right tools and frameworks can simplify building and optimizing your machine learning model. Below, we outline popular libraries, visualization tools, and workflow management options that are ideal for wine quality prediction.
Recommended Machine Learning Libraries
These libraries provide robust algorithms and utilities for model building:
| Library | Use Case |
| scikit-learn | Ideal for beginners. Includes easy-to-use regression, classification, and evaluation tools. |
| XGBoost | Designed for gradient boosting. Known for efficiency and high accuracy. |
| TensorFlow/PyTorch | Suitable for advanced deep learning tasks. Used when neural networks are necessary. |
For a wine quality prediction project, scikit-learn is often sufficient unless your data demands more complex models.
Tools for Data Visualization
Visualization helps you understand patterns in your data and evaluate model performance:
- Matplotlib: Ideal for basic plots like histograms and scatter plots.
- Seaborn: Simplifies correlation heatmaps and box plots for feature analysis.
- Plotly: Great for interactive visualizations, useful when presenting results to others.
Workflow Management Tools
Managing experiments, tracking progress, and keeping your work organized is essential for any ML project:
- MLflow: Tracks experiments, parameters, and results.
- Weights & Biases: Provides experiment tracking with visualization dashboards.
- Jupyter Notebooks: Popular for exploratory analysis and documenting workflows.
Using these tools ensures you can replicate your results and communicate findings effectively.
Model Interpretation and Explainability Tools
Understanding how your model makes predictions can build trust and uncover issues:
- SHAP (SHapley Additive exPlanations): Explains individual predictions by measuring feature contributions.
- LIME (Local Interpretable Model-agnostic Explanations): Offers similar insights but focuses on localized predictions.
By using these tools and frameworks, you can streamline your workflow and focus on improving your model’s performance. In the next section, we’ll explore practical tips and common challenges you may encounter.
Practical Tips for Success

Building a wine quality prediction model is not without challenges. Below are practical tips to help you navigate common issues and optimize your project.
Common Challenges and How to Overcome Them
Class Imbalance in Wine Quality Scores
Problem: Quality scores are often skewed, with most wines rated in the mid-range (e.g., 5–7) and fewer high- or low-quality examples.
Solution: Use techniques like oversampling (e.g., SMOTE) or undersampling to balance the dataset. Alternatively, use evaluation metrics like F1 score or Precision-Recall AUC instead of accuracy.
Overfitting with Small Datasets
Problem: Models may perform well on training data but fail to generalize to new data.
Solution: Apply regularization techniques (e.g., L1/L2 regularization) and use cross-validation to detect overfitting early.
Feature Redundancy or Irrelevance
Problem: Including too many irrelevant features can reduce model performance.
Solution: Perform feature selection using correlation analysis or algorithms like Recursive Feature Elimination (RFE).
Noise in Data
Problem: Measurement errors or outliers can distort predictions.
Solution: Use robust preprocessing techniques, such as removing outliers and applying smoothing algorithms.
Best Practices for Machine Learning Projects
Document Everything
Keep detailed records of data preprocessing steps, model configurations, and evaluation results. Use tools like MLflow or a simple spreadsheet to track experiments.
Start Simple
Begin with basic models like Logistic Regression or Random Forest to get a baseline performance. Move to more complex algorithms only if necessary.
Test with Real-World Data
Evaluate your model using data that closely resembles real-world scenarios. For example, test it with wines from different regions or production years to assess its generalizability.
Iterate and Optimize
Machine learning is an iterative process. Experiment with different models, hyperparameters, and preprocessing techniques until you achieve consistent results.
Use Version Control for Code and Data
Tools like Git and DVC (Data Version Control) help you manage code and dataset versions, ensuring reproducibility.
By addressing these challenges and following these best practices, you’ll avoid common pitfalls and ensure your model delivers reliable results.
Use Cases and Real-World Applications of Wine Quality Prediction
Wine quality prediction has practical applications that directly benefit winemakers, businesses, and even consumers. Below are some ways this technology is being applied effectively.
How Wineries Use Wine Quality Predictions
Quality Control
Prediction models automate the evaluation of wine quality, providing consistent results and reducing the variability of manual sensory assessments.
Process Optimization
By identifying production factors that correlate with high-quality wine, winemakers can refine processes like fermentation, ingredient selection, and temperature control.
Cost Savings
Automation in quality checks minimizes the need for additional labor and resources, reducing production costs.
Predicting Consumer Preferences
Machine learning isn’t limited to assessing wine quality — it can also analyze consumer trends. By combining sales data with wine attributes, businesses can:
- Anticipate market demand for specific wine profiles (e.g., dry or sweet).
- Adjust production to match consumer preferences in different regions.
Applications Beyond Wine Quality
The same techniques used in wine prediction can also benefit other industries:
- Beverage Industry: Quality assessment for beer, spirits, and non-alcoholic drinks.
- Food Production: Predicting freshness or grading quality in processed foods.
- Agriculture: Evaluating factors like soil and crop health for improved yields.
Personalized Consumer Recommendations
Retailers and wine subscription services can use prediction models to enhance customer experiences. By analyzing customer feedback and wine features, they can:
- Provide personalized wine recommendations based on taste profiles.
- Increase customer satisfaction by improving product suggestions.
Machine learning in wine quality prediction provides practical benefits for producers and consumers alike.
About Label Your Data
If you choose to delegate data annotation, run a free data pilot with Label Your Data. Our outsourcing strategy has helped many companies scale their ML projects. Here’s why:
Rely on consistent, high-quality output for complex datasets, detailed taxonomies, and edge cases.
Get quality engineered into every step through onboarding, evolving guidelines, QA, and continuous feedback.
Adjust team capacity, project size, and delivery model as you scale, with no setup fees or long-term lock-ins.
Align on goals, workflows, and expectations with a team that integrates into your process from day one.
Work with former annotators who understand annotation complexity, quality standards, and high-volume delivery.
FAQ
Which algorithm is used for wine quality prediction?
Algorithms like Random Forest, Gradient Boosting (e.g., XGBoost), and Logistic Regression are commonly used for wine quality prediction. Random Forest is favored for its accuracy, while Logistic Regression is simpler and interpretable. Neural Networks are also applicable for more complex datasets.
How to calculate wine quality?
- Gather data on wine's chemical properties.
- Preprocess the data (cleaning, scaling, and normalizing).
- Train a machine learning model on labeled data.
- Use the model to predict quality scores for new wines.
What is the wine market prediction?
Wine market prediction involves using data and machine learning models to forecast trends in wine sales, pricing, and consumer preferences. It helps producers and retailers optimize production and marketing strategies.
Is wine quality prediction classification or regression?
Wine quality prediction can be either classification or regression. Wine quality classification predicts discrete quality labels (e.g., a score from 1 to 10), while regression predicts continuous values. The approach depends on the data and the specific use case.
Written by
CEO of Label Your Data
Karyna is the CEO of Label Your Data, a company specializing in data labeling solutions for machine learning projects. With a strong background in machine learning, she frequently collaborates with editors to share her expertise through articles, whitepapers, and presentations.