Deforestation Monitoring: AI Methods for Tracking Forest Loss

 CEO of Label Your Data
Table of Contents
TL;DR
- AI has turned forest monitoring into a continuous system that flags new clearings within days of them happening.
- Optical satellites reveal where the canopy is gone, while cloud-penetrating radar catches the same loss in the wet tropics when optical sensors go blind for months.
- The model architecture rarely decides accuracy in production, because a deforestation detector is only ever as reliable as the labeled satellite data it learned from.
Satellite imagery for forest monitoring has never been more abundant or more open, with the entire Sentinel and Landsat archives free to anyone.
The constraint, however, is whether a model can separate real clearing from cloud, shadow, and seasonal change, which depends almost entirely on how its training data was prepared.
As ML teams build models that flag forest loss within days of it happening, we cover how these AI deforestation monitoring systems work and what determines their accuracy in production.
What Is AI-Powered Deforestation Monitoring?
Deforestation monitoring is the practice of detecting and measuring forest loss over time using remote sensing data, most often satellite imagery processed by classification or change-detection models.
To build the right model, you need to get a handle on the differences between these definitions:
- Deforestation refers to the permanent conversion of forest to another land use, such as cropland or pasture
- Forest degradation describes a partial loss of canopy or biomass without full conversion
- Tree cover loss, the metric reported by most global datasets, includes both of these plus temporary losses from logging rotations and fire
These distinctions are nothing but labeling decisions before they turn into training and testing data for your model. Trained on tree cover loss labels, it will flag a harvested timber plantation as positive, which is correct for that target and wrong for a deforestation-specific use case.
The first thing you need to do before starting data annotation is to define the class boundary.
The right class boundary depends on what the model is for. The same scene can yield different labels across use cases:
| Use case | What counts as the positive class | Typically excluded | Most common label error |
| Supply-chain compliance (e.g., EUDR) | Forest cleared after a fixed cutoff date | Loss before the cutoff, natural canopy gaps | Flagging a harvested plantation as deforestation |
| Carbon and REDD+ crediting | Permanent, stand-replacing forest loss | Logging rotations, seasonal change | Crediting temporary loss as permanent |
| Biodiversity and degradation tracking | Partial canopy or biomass loss | Counting only full clearing | Missing sub-canopy degradation in optical data |
| Enforcement alerts (DETER-style) | Any new disturbance, regardless of cause | Previously known or older clearings | Re-flagging prior alerts as new |
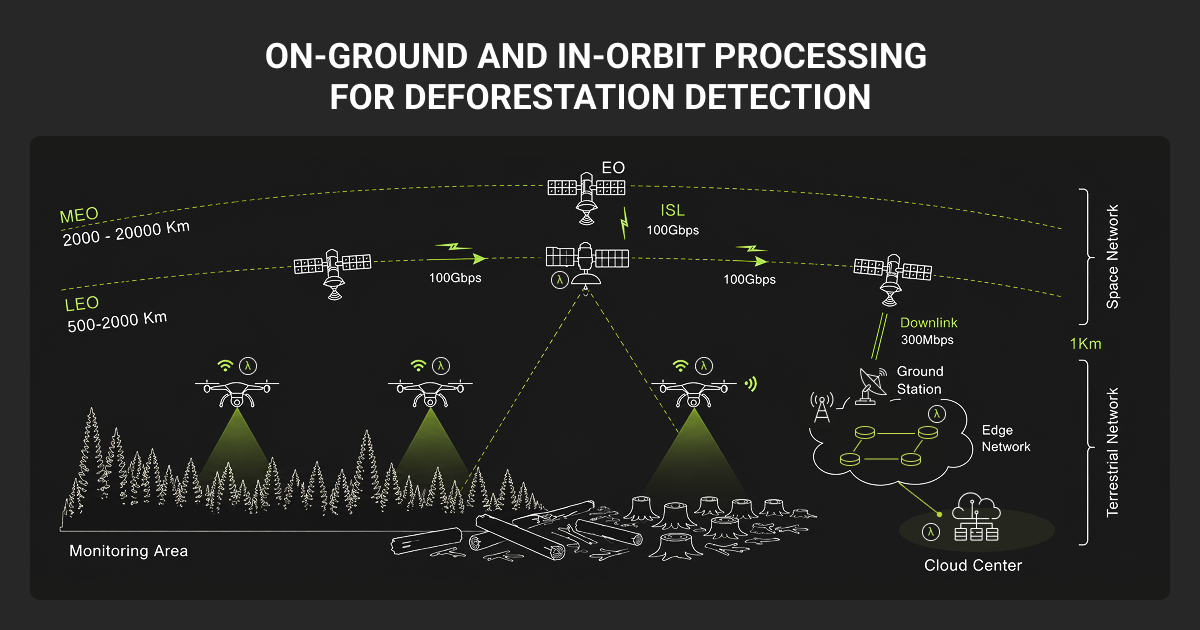
How Deforestation Detection Works: Pipeline Overview
With the class boundary defined, AI detects forest loss by learning the spectral and structural signatures of forest, non-forest, and recent disturbance from labeled imagery, then applying that model to new acquisitions to flag change.
A working pipeline has three layers:
- Data: collect optical, radar, or drone imagery over the target area
- Model: classify each pixel or detect change against labeled examples
- Alerting: flag and route new disturbances for review or enforcement
Satellite and aerial data sources
Most deforestation monitoring operational systems run on freely available satellite data.
Optical sensors such as NASA’s Landsat (30 m resolution) and the ESA Sentinel-2 (10 m) capture multispectral reflectance, which separates healthy canopy from bare soil through vegetation indices like NDVI.
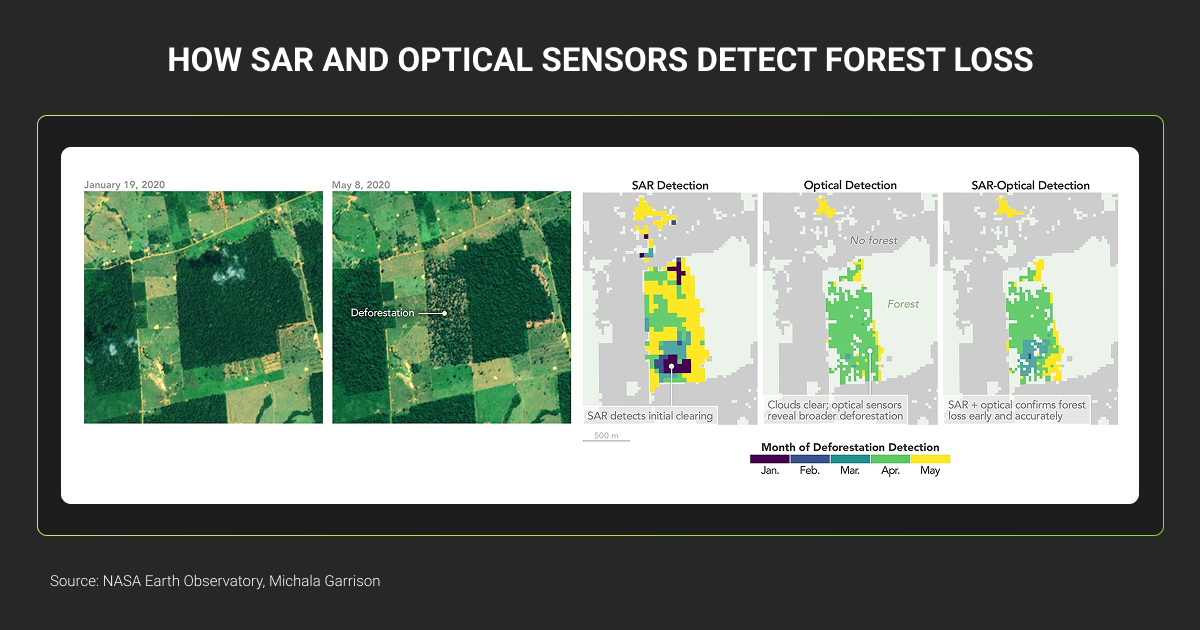
Synthetic aperture radar (SAR) from Sentinel-1 penetrates cloud and works day or night, a decisive advantage in the persistently cloudy humid tropics where optical sensors can go months without a clear view.
Drone and high-resolution commercial imagery add sub-meter detail for project-level verification and ground truth.
Sensor choice drives the labeling workflow. Optical bands are intuitive for data annotators to interpret, while SAR backscatter requires data annotation services from trained specialists who read radar texture rather than visible color.
From change detection to deep learning
Early monitoring relied on pixel-based change detection and classical classifiers such as random forests applied to spectral differences between two dates. These methods still appear in production for their interpretability and low compute cost.
Deep learning now sets the accuracy benchmark. Semantic segmentation architectures, U-Net and its variants, dominate the space because skip connections preserve the fine spatial detail needed for clean forest boundaries.
You may have come across this study on applying an Attention U-Net to Sentinel-2 imagery of the Amazon and Atlantic Forest. The research team from Lancaster University reported pixel-wise F1 scores between 0.95 and 0.98 across three datasets.
Time-series approaches that pair an LSTM with a segmentation network add temporal context, which helps separate genuine clearing from seasonal canopy variation.
The emerging direction is geospatial foundation models and transformer-based networks pretrained on unlabeled data from satellite imagery and then fine-tuned for a specific task. They reduce the labeled training data needed per project.
But thorough fine-tuning and validation still rest on accurately annotated examples from the target region.
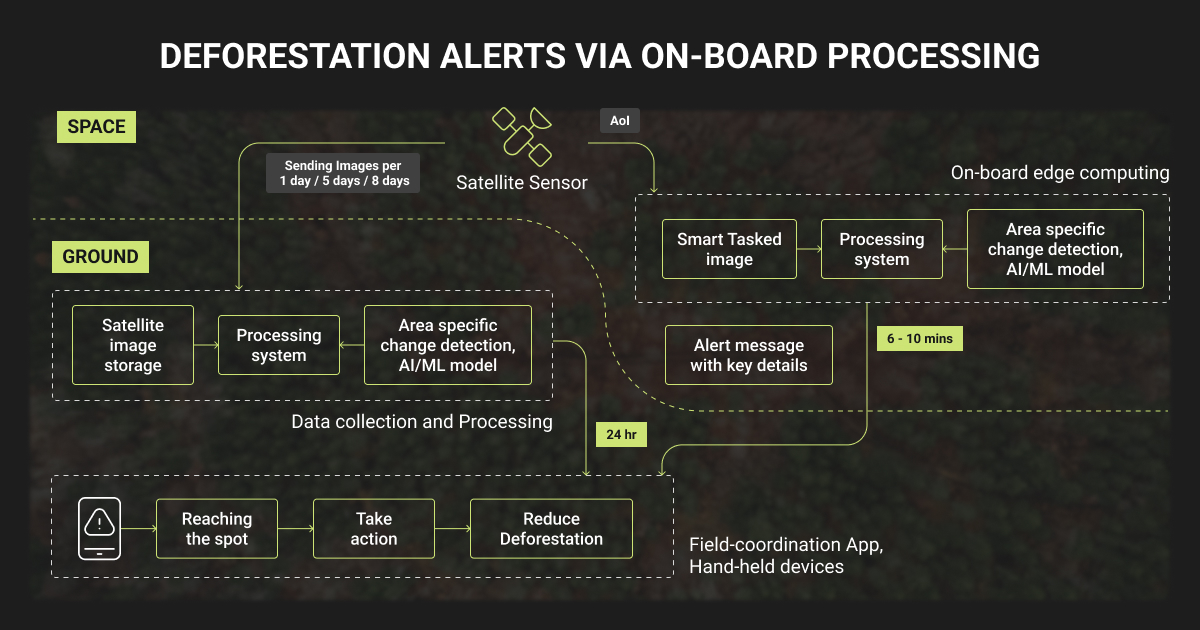
Near-real-time deforestation monitoring alert systems
Public systems show the operational pattern clearly. Global Forest Watch integrates four alert layers:
- GLAD-L from Landsat
- GLAD-S2 from Sentinel-2
- RADD from Sentinel-1 radar (developed at Wageningen University)
- DIST-ALERT from UMD and NASA
RADD issues weekly alerts at 10 m resolution, and because radar sees through cloud, it often detects small clearings days to months earlier than optical systems.
National programs such as Brazil’s PRODES and DETER, run by the space agency INPE, follow the same operational pattern for enforcement and official reporting, pairing annual mapping with faster lower-resolution alerts.
Deforestation Monitoring Model Challenges
The hardest problems in deforestation monitoring models are noisy, ambiguous imagery and a shortage of labeled data for new regions.
Cloud cover obstacle for optical pipelines
A fresh clearing can stay invisible for an entire wet season until a cloud-free image arrives, which is why radar and optical-radar fusion have become standard for timely detection.
Deforestation driver attribution
A model that flags loss still has to distinguish fire from logging from agricultural conversion, and those classes look different across spectral and radar data. Researchers have trained CNNs on combined Sentinel-1 and Sentinel-2 inputs specifically to attribute the cause of each detected disturbance, since an unattributed alert is far less actionable for a field team.
Class imbalance in the data
In any given scene, recent deforestation is a tiny fraction of the pixels, so a naive model can predict forest everywhere and still score high on raw accuracy. Precision, recall, and F1 on the disturbance class are the metrics that matter, and all three depend heavily on label quality.
Generalization to new regions
A model tuned on the Amazon often degrades over Congo Basin or Southeast Asian forests with different species and terrain, which is why region-specific annotated machine learning datasets stay essential.
Edge cases go wrong when an annotator has to interpret instead of apply a rule. The fix is to make them explicit in the guidelines, with concrete examples and clear decision boundaries, then use tooling to flag where annotators disagree or model confidence drops in production and feed those cases back into training.

 Founder, Deep AI
Why Label Quality Sets Deforestation Detection Accuracy
Every challenge above traces back to one dependency: supervised forest models are only as reliable as the masks they learn from.
Mislabeled boundaries and inconsistent class definitions propagate directly into model error, and missed small clearings are the hardest errors to catch on exactly the rare disturbance pixels that the use case cares about.
Geospatial annotation carries requirements that general image labeling does not. Polygons must align to a coordinate reference system and follow consistent rules for canopy edges and mixed pixels. They also have to integrate with GIS tooling such as QGIS rather than a generic image canvas.
With this particular challenge in its drone reforestation project, AirSeed Technologies has turned to Label Your Data for expert land segmentation work.
AirSeed is an Australian reforestation company that uses drones and machine learning to plant trees on degraded land. Its engineers needed large land areas segmented into plantable zones to train the computer vision models that guide planting drones. But they lacked internal capacity for time-consuming GIS labeling.
Working entirely inside QGIS, the Label Your Data team annotated more than 30 large geofiles across a five-month project, with no rework required after the first pilot round and labels that fit AirSeed’s ML and GIS stack without cleanup.
The [Label Your Data] workflow was smooth, progress was steady, and the data annotation quality consistently met our expectations throughout the drone reforestation project.
 Vice President of Engineering, AirSeed Technologies
Consistent polygon and semantic segmentation against a defined class taxonomy, with QA focused on edge cases, is what moves a deforestation detection model from a promising benchmark to a dependable production signal.
How to Build an Accurate Deforestation Monitoring System
For teams starting or scaling a deforestation monitoring or forest-monitoring model, a few decisions carry most of the weight.
- Define the target class precisely before annotation, separating deforestation, degradation, and routine tree cover loss so annotators apply one consistent rule.
- Match the sensor to the geography, defaulting to SAR or optical-radar fusion in cloud-prone tropics and to optical data alone where clear skies are reliable.
- Build a temporally consistent label set, since change detection depends on accurate before-and-after image pairs rather than single-date snapshots.
- Measure minority-class performance, tracking precision and recall on disturbance pixels instead of overall accuracy.
- Hold out a separate region for validation to expose generalization gaps before deployment.
Whether to label in-house or with a specialist data annotation company usually comes down to capacity and the cost of GIS expertise.
Teams weighing that tradeoff can estimate it against the hours their ML engineers would otherwise spend on annotation, and the data annotation pricing they’d avoid, before committing to a build.
About Label Your Data
Building or scaling a forest-monitoring model and need production-grade geospatial labels? See why AI teams choose Label Your Data and talk to us about a geospatial annotation pilot.
Rely on consistent, high-quality output for complex datasets, detailed taxonomies, and edge cases.
Get quality engineered into every step through onboarding, evolving guidelines, QA, and continuous feedback.
Adjust team capacity, project size, and delivery model as you scale, with no setup fees or long-term lock-ins.
Align on goals, workflows, and expectations with a team that integrates into your process from day one.
Work with former annotators who understand annotation complexity, quality standards, and high-volume delivery.
FAQ
What satellite resolution do you need for deforestation detection?
It depends on the size of the clearings you care about. Sentinel-2 at 10 m resolution reliably flags clearings of roughly half a hectare and larger, which covers most industrial deforestation.
Smallholder clearing, selective removal, and narrow access roads usually fall below that threshold and require sub-meter commercial satellite imagery or drone data, at the cost of much smaller coverage and higher price per square kilometer.
How much labeled data does a deforestation monitoring model need?
There is no fixed number, because the requirement scales with how varied the target region is.
A segmentation model trained from scratch for one biome typically needs thousands of annotated image tiles that balance forest, non-forest, and recent disturbance.
Transfer learning and geospatial foundation models lower that figure substantially, but every new biome with different canopy structure generally needs its own labeled set to avoid accuracy loss on transfer.
Can deforestation and forest degradation be monitored with sufficient accuracy?
Sufficiency depends on the decision the output feeds, not on a single benchmark number.
Outright deforestation is detected reliably enough that conservation groups and government agencies act on clearing alerts within days, in some cases dispatching enforcement teams within 24 to 48 hours.
Degradation is detected less reliably, because partial canopy loss leaves a fainter signal than full clearing, so teams that need degradation data usually accept a higher error rate or invest in richer inputs.
A carbon-credit audit, an EUDR screening, and a law-enforcement response each tolerate very different rates of false alarms and missed events, which is what ultimately defines whether accuracy is sufficient.
Written by
CEO of Label Your Data
Karyna is the CEO of Label Your Data, a company specializing in data labeling solutions for machine learning projects. With a strong background in machine learning, she frequently collaborates with editors to share her expertise through articles, whitepapers, and presentations.