Satellite Imagery Analysis: End-to-End ML Workflow

 CEO of Label Your Data
Table of Contents
- TL;DR
- Preprocessing Data for Satellite Imagery Analysis
- Annotating Data for Satellite Imagery Analysis
- Quality Assurance and Inter-Annotator Agreement
- Training Model with Satellite Labels: Architecture Considerations
- Domain-Specific Augmentation in Satellite Imagery Analysis (with Pretraining Strategies)
- Scaling Satellite Imagery Analysis for Production
- Setting Up a Geospatial Annotation Workflow
- About Label Your Data
- FAQ

TL;DR
- Preprocessing steps like tiling, cloud masking, and projection alignment are essential before labeling or training.
- Satellite image annotation varies by task and often requires pixel-level accuracy and spectral expertise.
- Quality assurance at scale needs inter-annotator checks, edge-case rules, and automated spatial validation.
- Model architectures must handle multi-band inputs, large image sizes, and sometimes temporal dependencies.
- A production-grade pipeline includes batch inference, retraining workflows, and region-specific model refreshes.
Preprocessing Data for Satellite Imagery Analysis
Satellite imagery analysis uses remote sensing data to detect patterns, classify regions, or monitor changes across Earth’s surface. These tasks power models for agriculture, climate monitoring, infrastructure, and more.
But before any ML model training starts, you need to get the raw data into shape. Satellite images are massive, multi-band, and full of artifacts like clouds, shadows, or misaligned tiles. Before you label or train anything, you need to align projections, remove noise, and standardize inputs.
Image preparation
Start by standardizing coordinate reference systems (CRS) across datasets. Orthorectify to correct distortions from terrain and satellite angle. Then split large images into fixed-size tiles (e.g., 512×512 px) for training; many models can’t handle full-size imagery directly.
Noise reduction
Clouds, shadows, and seasonal drift all interfere with learning. Use built-in cloud masks (e.g., Sentinel-2’s cloud probability bands) to filter out noise. Normalize images from different seasons to account for vegetation cycles or lighting variation.
We lost weeks of work because different satellite providers delivered imagery with inconsistent coordinate systems. Our fix? A coordinate validation checkpoint that rejects nonstandard CRS before it hits the AI pipeline. It eliminated 90% of false location errors.

 CEO & Founder, GrowthFactor
Annotating Data for Satellite Imagery Analysis

Labeling satellite imagery isn’t like labeling standard photos. You’re often working with multiple spectral bands, huge image tiles, and evolving geographic features. The data annotation format, and the difficulty, depends entirely on the task.
Instance segmentation vs pixel classification
Object detection often uses bounding boxes or polygon masks. But land-cover tasks require pixel-wise labeling for each class, which is far more complex to annotate and QA.
Spectral and false-color bands
You can’t always see your target object in true color. For vegetation, NDVI thresholds or infrared channels might be needed. Data annotators must understand how features appear in false-color composites to label them accurately.
Label drift over time
Land use, crop coverage, and vegetation all change seasonally. A training set from one time period may not match the distribution later. Labels need to be reviewed across time slices to avoid model degradation.
Quality Assurance and Inter-Annotator Agreement

Labeling satellite imagery can be inconsistent if you don’t build in QA from the start. Unlike natural images, edge cases in satellite data often hide in resolution artifacts, seasonal changes, or spectral anomalies. QA needs to go beyond basic spot checks.
Labeling guidelines for geospatial data
You can’t just hand annotators a satellite tile and say “draw polygons.” Annotation guidelines must explain:
- How to interpret multi-band images
- What counts as a valid object in low-resolution or seasonal shifts
- How to handle edge cases like cloud overlap, blurry boundaries, or shadows
An experienced data annotation company often builds these rules into interface hints, training modules, and review loops. You need domain experts for such niche projects.
Automated QA checks and metrics
Automated checks can catch consistency issues across large machine learning datasets:
- IoU (Intersection over Union) thresholds to flag low-agreement labels
- Tile-to-tile consistency using label density or edge continuity
- Metadata-driven QA, e.g., verifying that labels only exist in cloud-free tiles or during known crop growth seasons
Some teams also apply spatial smoothing techniques to labels across neighboring tiles. It’s useful for land-cover tasks with fuzzy boundaries. At scale, you need automated filters to catch systematic issues before manual review.
Satellite pipelines often falter because corrupted files or bad metadata slip past ingestion. A simple QA checkpoint with automated flags right after ingestion saved us hours of debugging and improved reliability.
 Chief Technology Officer, Cybersecurity Consultant and Author, The Cyber Threat
Training Model with Satellite Labels: Architecture Considerations
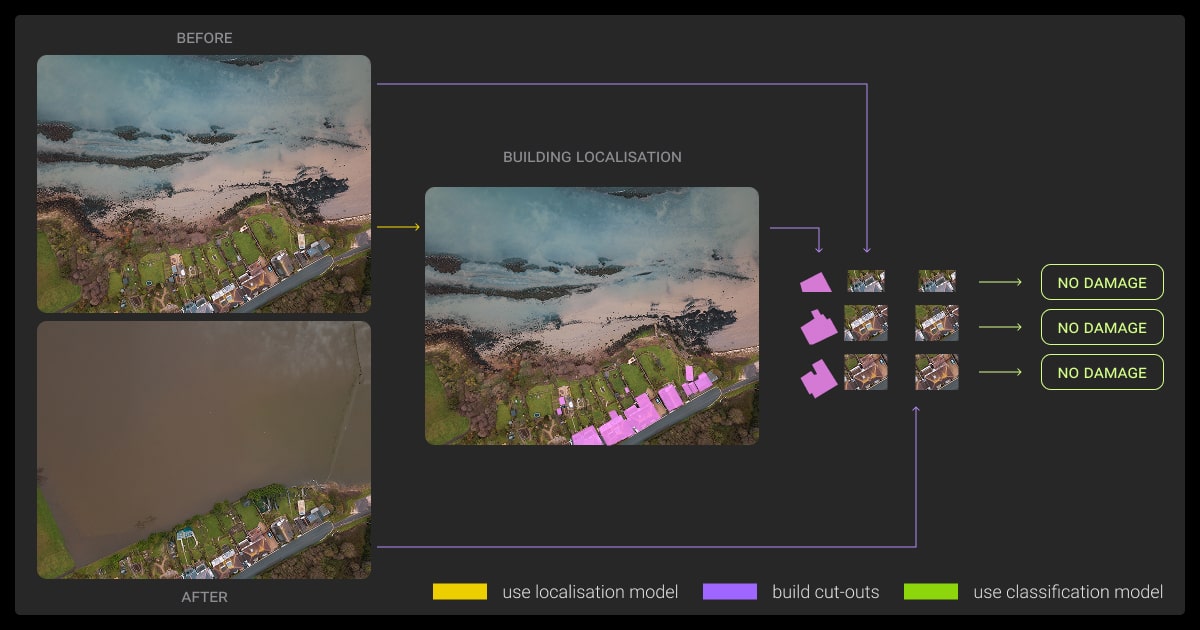
Training any machine learning algorithm on satellite imagery comes with unique challenges: multi-band inputs, massive image sizes, and temporal sequences.
Choosing the right architecture means balancing resolution, speed, and task-specific demands like segmentation or change detection. Below are common approaches used in satellite ML workflows.
For high-res, multi-band satellite data
For static satellite tasks like land cover classification or object detection, these models are widely used:
- U-Net and DeepLabV3+: Popular for semantic and instance segmentation.
- ResNet variants: Often used as backbones for image classification or detection.
- High-resolution strategies: Patch-based input (tiling) to handle memory-heavy commercial images.
These models can process 3-15 (and more) spectral bands depending on how input channels are configured. They are designed to support image recognition tasks like identifying roads, buildings, or crop boundaries across large-scale geospatial datasets.
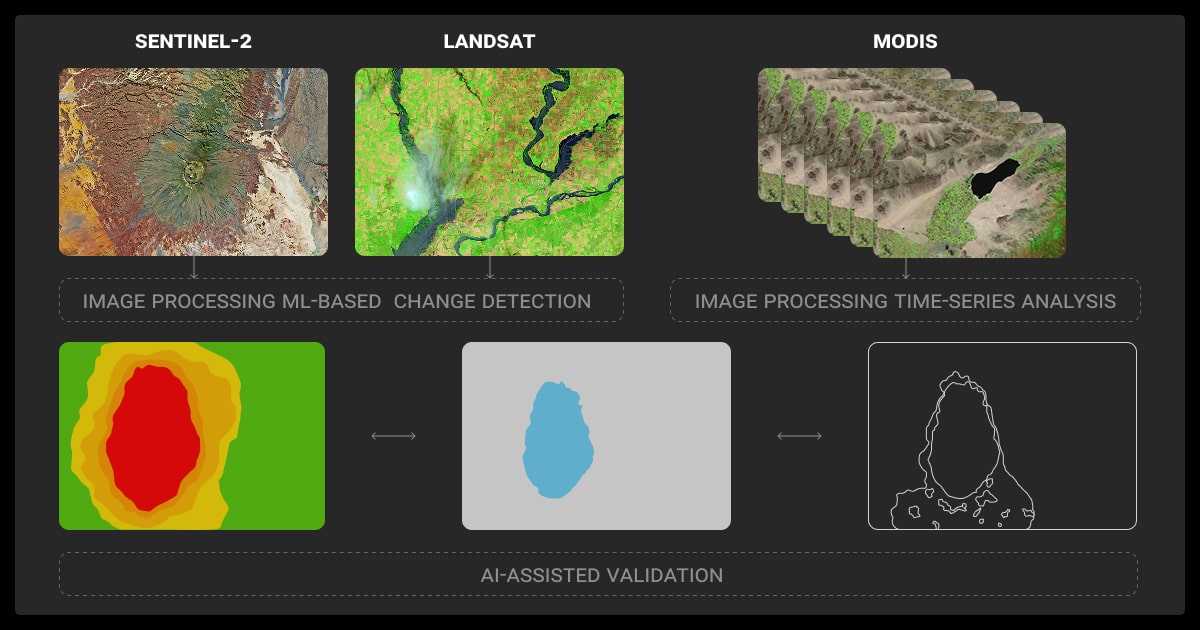
For tracking changes over time
For time-dependent tasks such as change detection, crop growth tracking, or seasonal monitoring:
- Siamese networks: Compare two time points (before/after) for binary or segmentation-based change detection.
- RNNs: Useful for learning sequential patterns in multi-temporal datasets.
- Transformers: Handle longer sequences and spatial-temporal attention across multiple snapshots.
These architectures require well-aligned image stacks and consistent revisit intervals.
Domain-Specific Augmentation in Satellite Imagery Analysis (with Pretraining Strategies)
Satellite imagery differs from everyday image datasets; more bands, less labeled data, and strong seasonal variation. Data augmentation and model pretraining need to reflect that.
Here’s how ML teams adapt their pipelines to geospatial realities.
Spectral and spatial augmentation
You can’t rely on generic flips and crops. Instead, consider:
- Spectral jittering: Slightly alter individual bands to simulate sensor noise or lighting variation.
- Seasonal mixing: Blend samples from different months to improve robustness to vegetation or snow cover.
- Spatial shifts: Small translations mimic geolocation drift without breaking the label alignment.
These augmentations help models generalize across different satellites and collection conditions.
Pretraining with self-supervised learning
Labeled satellite data is limited. Pretraining models on large unlabeled tile sets (e.g., from Sentinel-2 or Planet) gives you a head start. Common methods:
- Masked autoencoders (MAE): Learn to reconstruct missing patches of multi-band inputs.
- Contrastive learning: Train the model to distinguish between similar and dissimilar tiles using spatial context.
Pretraining works especially well for downstream tasks like land classification or disaster monitoring, where labeled data is scarce but imagery is abundant.
Scaling Satellite Imagery Analysis for Production
Satellite ML models must run efficiently on large datasets, support region-specific updates, and handle changes over time. A scalable pipeline manages data ingestion, labeling, inference, and retraining.
Key challenges and practices:
- Large image handling: Split images into uniform tiles for processing. Use sliding windows or grid-based chunking to avoid edge artifacts.
- Batch inference: Deploy models in pipelines that can process batches of images across regions or time windows. Use cloud compute with geospatial libraries (like Rasterio, Dask, or Google Earth Engine) for scalability.
- Model and region drift: Monitor accuracy decay as regions change or models age. Automate evaluation against recent ground truth (e.g., updated land use maps).
- Retraining loops: Flag low-confidence predictions, trigger targeted relabeling, and continuously update the model using recent data.
The GIS-to-ML handoff is where most failures happen. We fixed this by wrapping GDAL in a Python API and enforcing metadata schemas, reducing preprocessing failures by over 60%.
 Founder & Principal Software Architect, Cirrus Bridge
Setting Up a Geospatial Annotation Workflow

Labeling geospatial data is more complex than labeling natural images. You’re dealing with coordinate systems, multi-band inputs, and edge cases that shift over time.
Here’s how to avoid common pitfalls.
Start with a Data Audit
Before labeling:
- Align CRS across tiles
- Check for projection errors or misaligned mosaics
- Confirm metadata: timestamps, band order, resolution
- Standardize file formats and tiling
Skipping this step leads to label misplacement and low model accuracy.
Pick the Right Data Annotation Partner
Ask:
- Can they work with multi-spectral inputs like Sentinel or Landsat?
- Do they support pixel-level masks and NDVI labeling?
- How do they QA seasonal or cloud-heavy datasets?
- What’s their approach to edge cases and tool flexibility?
Don’t overlook data annotation pricing. Look for expert data annotation services that never skip QA and can handle geospatial tasks.
Decide: In-House or Outsourced?
The choice between in-house vs. outsourcing data annotation comes down to capacity, speed, and task complexity.
Choose in-house if:
- You have GIS-trained annotators
- The data is sensitive or needs expert review
- You’re labeling a small or iterative dataset
Outsource when:
- You need speed and scale
- The task involves thousands of tiles
- Your ML team wants to focus on model performance, not labeling
About Label Your Data
If you choose to delegate data annotation, run a free data pilot with Label Your Data. Our outsourcing strategy has helped many companies scale their ML projects. Here’s why:
Rely on consistent, high-quality output for complex datasets, detailed taxonomies, and edge cases.
Get quality engineered into every step through onboarding, evolving guidelines, QA, and continuous feedback.
Adjust team capacity, project size, and delivery model as you scale, with no setup fees or long-term lock-ins.
Align on goals, workflows, and expectations with a team that integrates into your process from day one.
Work with former annotators who understand annotation complexity, quality standards, and high-volume delivery.
FAQ
How to analyze a satellite image?
- Preprocess the image: georeferencing, orthorectification, and cloud masking
- Stack and normalize spectral bands
- Extract features (e.g., NDVI, NDBI) for classification
- Use ML models (like CNNs) for detection or segmentation
- Validate outputs using ground truth or expert review
What are the methods of satellite imagery analysis?
Methods include pixel-based classification, object-based segmentation, change detection, spectral index calculation (like NDVI), and deep learning approaches using CNNs or transformers.
What is a satellite image analysis system?
It’s an integrated setup that handles image preprocessing, labeling, model inference, and visualization. These systems combine tools like Rasterio, GeoPandas, and PyTorch, and often plug into cloud platforms or GIS software to scale processing and QA.
How to get satellite imagery data?
- Use USGS Earth Explorer for Landsat
- Use Copernicus Hub for Sentinel
- Use ASF DAAC for SAR data
- Use APIs like SkyWatch for preprocessed tiles
- Buy high-res images from Planet, Maxar, or Airbus
What format is satellite imagery?
GeoTIFF is the most common format, containing raster data with spatial metadata. Others include JPEG2000 (Sentinel-2), NetCDF/HDF (MODIS), and SAFE (Sentinel archive structure).
What is the difference between LiDAR and satellite imagery?
LiDAR generates 3D point clouds using lasers, ideal for elevation and structure data. Satellite imagery captures 2D raster images across multiple bands and is better suited for land use, vegetation monitoring, and temporal change detection.
Written by
CEO of Label Your Data
Karyna is the CEO of Label Your Data, a company specializing in data labeling solutions for machine learning projects. With a strong background in machine learning, she frequently collaborates with editors to share her expertise through articles, whitepapers, and presentations.