Map Labeling: Techniques for Geospatial ML Projects

 CEO of Label Your Data
Table of Contents

TL;DR
- Map labeling isn’t just a cartography concern, it directly affects geospatial ML tasks like OCR on tiles, weak supervision, and synthetic data generation.
- Good labeling practices combine clarity, visual hierarchy, and usability, making maps both human-readable and machine-usable.
- ArcGIS, QGIS, and automated rendering pipelines are core tools; automation is essential at scale.
- Dense cities, multilingual tiles, and micro-polygons need custom rules, inset maps, and dynamic scaling.
- QA automation ensures consistency, and performance benchmarking tracks throughput and error rates in production workflows.
Practical Map Labeling Rules for ML Pipelines
Map labeling looks simple, but in geospatial ML pipelines it can matter as much as feature engineering or data augmentation.
Inconsistent or overlapping labels inject noise that propagates through any machine learning algorithm consuming map tiles, degrading downstream performance in OCR tasks, weak supervision, or synthetic data generation. Such labels introduce noise that degrades performance in scene parsing, tile OCR, or map-to-satellite alignment.
The challenge is balancing automation with control. In static cartography, labels can be hand-tuned, but ML workflows generate tiles dynamically and update continuously. Labels must scale across zoom levels, handle dense geometries, and respect context rules. Overly strict rules miss edge cases; too loose, and maps look like randomly overlaid raw unlabeled data.
Core Map Data Labeling Techniques
Data annotation is a mix of engineering and design. Your machine learning datasets, models, annotation teams, and end users all benefit when you apply clear placement rules, a defined hierarchy, and legible styling. This becomes even more important when you’re working with data annotation services because it keeps everyone on the same page.
Want a quick cheat sheet? Read our guide to geospatial annotation to learn the best practices on how to label maps and other geospatial data.
Placement rules
Start with predictable placement. The model should always see labels where it expects them.
- Anchor labels to geometry: Center text on points or place them slightly offset for clarity. For polygons, use interior points or curved alignment instead of raw centroids
- Enforce collision detection: resolve conflicts with priority-based suppression; avoid uncontrolled overlaps
- Use offsets before shrinking text below readability; define minimum font sizes at small tile scales
- Tie placement to zoom levels: At country level, show only borders and capitals; zoom in, and progressively reveal roads and landmarks
These rules keep your labeling deterministic. Models trained on consistent maps learn better spatial relationships.
Label hierarchies
Your dataset has inherent structure and your labels should reflect that.
- Prioritize high-importance features: Roads, rivers, and major cities should have larger fonts and higher z-order
- Use data-driven ranking: Rank features by attributes (traffic volume, administrative level, etc.). Don’t hardcode every case
- Scale visibility dynamically: Suppress minor labels at low zoom levels to keep tiles clean
A clear hierarchy is not just good UX, it helps your ML models focus on dominant features, reducing training noise.
Styling and legibility
Styling choices are functional, not aesthetic.
- Fonts: Stick to sans-serif fonts for clarity; serif fonts lose definition at small sizes
- Color contrast: Balance text against the base map; avoid colors that blend with roads or land types
- Halos and shields: Apply thin halos to improve contrast without harming OCR legibility
- Font scaling rules: Define minimum readable font sizes; don’t let automation shrink them below usability
Good styling speeds annotation review cycles and improves OCR-like tasks, which are common in automated map processing pipelines. This reduces data annotation pricing.
We have discovered how to use model uncertainty as a strategic tool which guides human expertise to the most critical areas. This approach stands in direct opposition to the conventional method, which causes humans to spend time on tasks that machines could accomplish automatically. Experts achieve better work quality and higher engagement when they concentrate on difficult cases instead of repetitive routine work.

 CEO, LegalOn
Software and Tools for Map Labeling Workflows
GIS tools are your starting point. Whether you use a commercial platform or open source, automation is non-negotiable for ML workflows. If you’re not sure how to proceed, you can hire data collection services to help.
ArcGIS
ArcGIS is a powerhouse for enterprise geospatial work, and its Maplex Label Engine is a labeling benchmark:
- Collision detection and rule enforcement are built in
- Placement algorithms handle curves and complex polygons well
- Data-driven styling lets you dynamically size, color, or prioritize labels from feature attributes
- Integrates with Python for scripting, batch processing, and tile rendering
ArcGIS is ideal when datasets are large, teams need enterprise support, or you’re delivering production-grade cartography.
QGIS
QGIS offers comparable functionality with open-source flexibility:
- Rule-based labeling: Build granular placement and visibility rules tied to attributes
- Expression-driven styling: Use its expression engine to apply logic dynamically
- Plugin support: Extend functionality with plugins like “EasyCustomLabeling”
- Python automation: PyQGIS enables batch labeling and tile generation
For ML engineers, QGIS is a strong choice if you need a customizable toolchain or want to build your own rendering stack.
Both tools integrate seamlessly with broader GIS data collection workflows, making it easier to tie raw spatial datasets, labeling rules, and rendering pipelines together in production environments.
Map labeling automation
Manual edits cause bottlenecks so you should automate early:
- Algorithmic placement: Let heuristics handle baseline placement; tweak with scripting for edge cases
- Batch styling rules: Scripts can adjust text size, color, and placement based on dataset attributes
- Tile rendering automation: Use Tippecanoe (vector tiles), Mapbox GL / MapLibre GL, or Tegola/OpenMapTiles. Mapnik/MapServer are still used for raster pipelines
- ML-powered approaches: Research explores RL and DL for label placement, but these remain experimental; production systems still rely on rules and heuristics
The goal is to make your labeling pipeline repeatable, auditable, and fast enough to iterate with model development cycles.
Still don’t have the time or enough resources? You can turn to a trusted data annotation company for object detection tasks in geospatial annotation and let them handle your map data.
Edge Cases in Map Labeling and How to Handle Them
Maps rarely stay simple. Dense geometries, small features, and multilingual needs require custom logic, making automated map interpretation through image recognition and OCR more challenging.
Labeling dense areas
Urban environments create clutter fast. You should:
- Simplify geometry at lower zoom levels
- Prioritize major roads and landmarks; hide minor streets until users zoom in
- Use inset maps for dense downtown areas without crowding main tiles
These methods balance usability for humans while reducing tile complexity for ML models.
Small area and boundary labels
Micro-polygons like parcels, waterways, or administrative boundaries often don’t have space for labels.
- Curved labels along polygon edges maximize space
- Callouts or leader lines maintain context without clutter
- Suppress labels for very small features until high zoom levels
This keeps maps clean while preserving key data for zoomed-in ML and human use cases.
Multi-language or thematic maps
Multilingual labeling introduces complexity because text length varies across languages.
- Localize dynamically, don’t stack multiple languages on a single tile
- Use abbreviations or standard codes for thematic datasets
- Apply clear layer hierarchies so base map labels don’t compete with thematic overlays
- Handle text shaping, font fallback, and glyph coverage for scripts like Arabic, Indic, and CJK to avoid clipping or reflow
Automating this is easier with proper localization tooling and separate vector tile sets per language.
Instead of labeling an entire dataset upfront, we trained an initial model on a small subset, let it generate predictions across the dataset, and then had human annotators only correct or validate the ‘uncertain’ areas. This cut down manual effort dramatically… The real win wasn’t just efficiency; it was consistency.
 Founder & CEO, Amenity Technologies
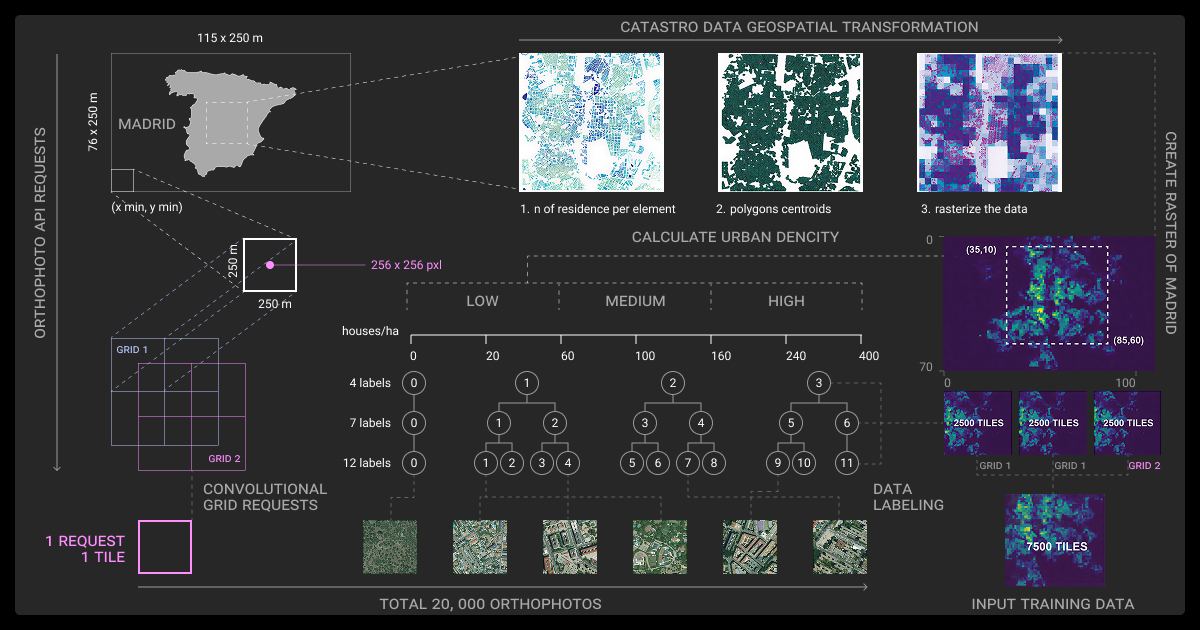
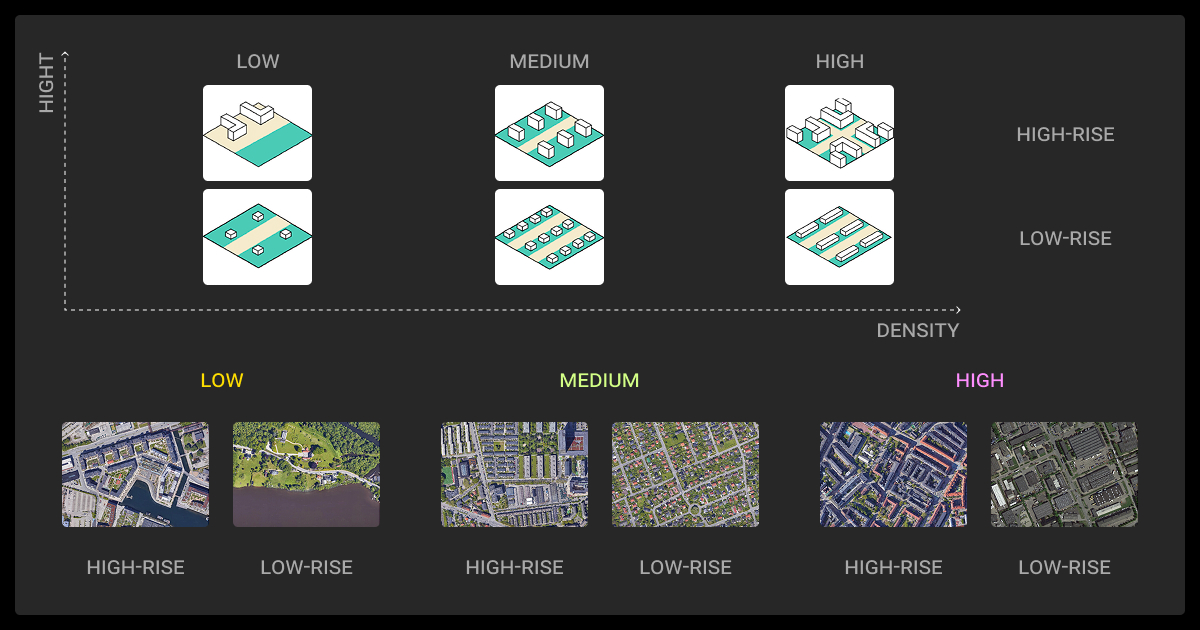
These challenges often surface in satellite imagery analysis, where dense urban tiles or micro-polygons like parcels and waterways require precise labeling rules to avoid noise in training data.
QA and Performance for Geospatial ML Projects
Without QA, labeling quickly drifts into inconsistency, which wrecks downstream models. A QA layer ensures reproducibility and trustworthiness.
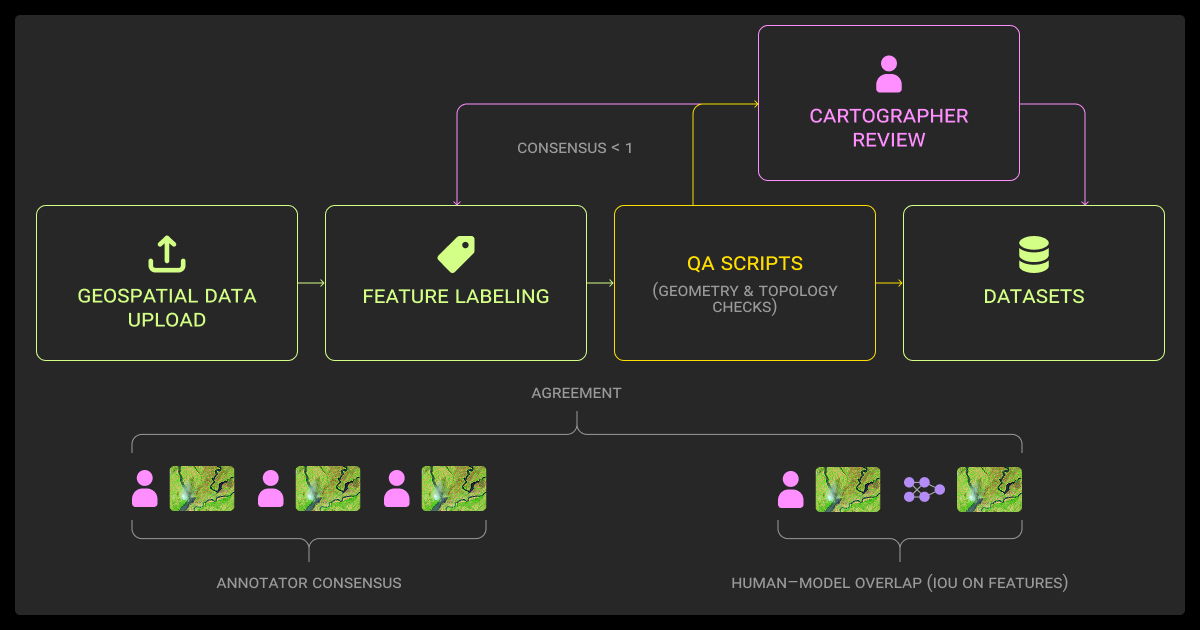
Accuracy and inter-annotator agreement
If you’re using human data annotators to annotate features or validate automated labels:
- Track agreement rates using metrics like Cohen’s kappa or Krippendorff’s alpha
- Maintain a gold-standard dataset for calibration and drift detection
- Separate human agreement metrics from machine-oriented metrics such as OCR precision/recall/F1, detection AP, or placement offset error
This is critical when map labels serve as inputs to supervised ML models, where placement and consistency directly affect the training signal.
Automation with QA layers
QA checks should be scripted:
- Validate placement constraints to catch overlaps automatically
- Run attribute validation to ensure input data isn’t corrupt
- Scan rendered tiles programmatically for missing or clipped labels
- Track quantitative QA metrics such as collision rate, omission/commission, and distance from anchor point per tile/zoom
These checks save engineering time and give early warnings about dataset inconsistencies.
Performance benchmarks
You can’t improve what you don’t measure.
- Track throughput: features labeled per hour or tiles processed per batch
- Monitor error rates: measure overlap errors, clipping issues, or missing labels
- QA cycle times: watch review iteration durations to spot bottlenecks
- Log system counters: tiles/sec, render latency, cache hit rate, and re-render rate after data/style updates
Metrics help prioritize automation investments and demonstrate efficiency improvements to stakeholders.
About Label Your Data
If you choose to delegate map labeling, run a free data pilot with Label Your Data. Our outsourcing strategy has helped many companies scale their ML projects. Here’s why:
Rely on consistent, high-quality output for complex datasets, detailed taxonomies, and edge cases.
Get quality engineered into every step through onboarding, evolving guidelines, QA, and continuous feedback.
Adjust team capacity, project size, and delivery model as you scale, with no setup fees or long-term lock-ins.
Align on goals, workflows, and expectations with a team that integrates into your process from day one.
Work with former annotators who understand annotation complexity, quality standards, and high-volume delivery.
FAQ
How to label a map correctly?
- Anchor labels directly to the geometry they describe so that points, lines, or polygons always keep their label in the right spatial context.
- Apply collision detection to prevent overlaps by dynamically repositioning or hiding labels when they would collide with others.
- Scale visibility with zoom levels by reducing label density at low zooms and adding finer details as the user zooms in.
- Automate placement with algorithms or labeling engines to handle large datasets and repetitive tiles efficiently.
- Review complex tiles manually to fix edge cases, such as dense urban areas or overlapping boundaries, where automation may fail.
What are map labels?
They’re the text or symbols identifying geographic features – roads, landmarks, and boundaries. In ML contexts, map labels can also act as input signals for OCR, weak supervision, or synthetic data generation.
How do I label something on maps?
Use GIS tools (ArcGIS, QGIS), write placement rules, choose clear fonts, and automate scaling. Use scripting for large datasets to avoid manual bottlenecks. For polygons, prefer interior points (e.g., polylabel) or curved alignment instead of raw centroids.
What are the 4 types of map symbols?
Point symbols, line symbols, area symbols, and text labels. These form the foundation of any cartographic or geospatial representation.
Written by
CEO of Label Your Data
Karyna is the CEO of Label Your Data, a company specializing in data labeling solutions for machine learning projects. With a strong background in machine learning, she frequently collaborates with editors to share her expertise through articles, whitepapers, and presentations.