Confusion Matrix: How to Use It to Spot Model Blind Spots

 CEO of Label Your Data
Table of Contents
- TL;DR
- What Is a Confusion Matrix?
- How Does a Confusion Matrix Work?
- How to Read a Confusion Matrix
- What Does a Confusion Matrix Tell You?
- How to Calculate Metrics from a Confusion Matrix
- Confusion Matrix for Multiclass Classification
- When Should You Use a Confusion Matrix?
- Confusion Matrix vs ROC Curve
- How to Build a Confusion Matrix
- Ready to Fix Your Model Blind Spots?
- About Label Your Data
- FAQ

TL;DR
- Your model’s accuracy looks great, but a confusion matrix reveals it’s failing on the cases that actually matter, like missing fraud or flagging healthy patients as sick.
- Stop guessing why your classifier underperforms when one simple grid breaks down every prediction type and shows you exactly which classes get confused most often.
- Learn to read the matrix in under five minutes and immediately spot whether your model is too cautious, too aggressive, or just needs better training data for specific edge cases.
A confusion matrix is a table that shows where your classification model gets predictions right and where it fails. It compares predicted labels against actual labels, breaking down errors by type. This makes it easier to spot patterns in misclassifications and fix blind spots before deployment.
If you’re training a model on annotated data from data annotation services, a confusion matrix helps validate that your labels translate into accurate predictions.
What Is a Confusion Matrix?
Confusion matrix in machine learning displays the performance of a classification model in a grid format. Each cell represents the count of predictions in a specific category.
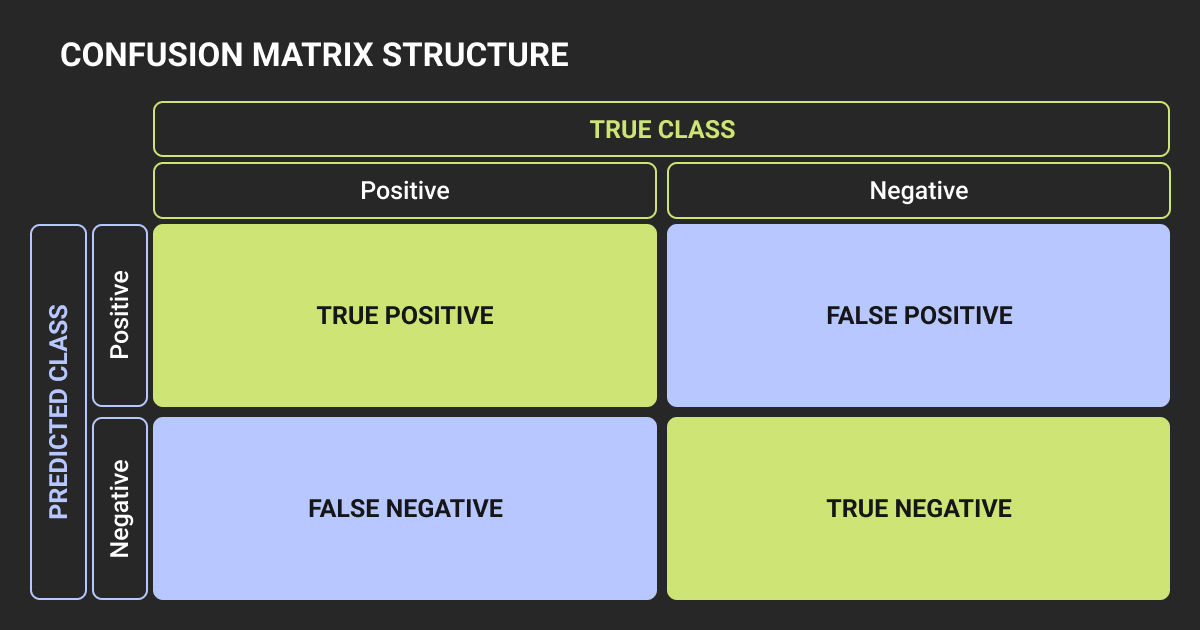
For binary classification, the matrix is 2x2. Rows show actual classes, columns show predicted classes. The four cells are:
- True Positive (TP): correctly predicted positive
- True Negative (TN): correctly predicted negative
- False Positive (FP): incorrectly predicted positive
- False Negative (FN): incorrectly predicted negative
This layout makes it easy to see which types of errors your model makes most often.
How Does a Confusion Matrix Work?
The matrix organizes predictions into buckets based on whether they match reality. You feed your model test data with known labels, collect its predictions, then count how many fall into each category.
Say you’re building a spam filter. You test it on 100 emails: 60 spam, 40 not spam. The model predicts 55 as spam and 45 as not spam.
Here’s what the confusion matrix machine learning looks like:
| Predicted Spam | Predicted Not Spam | |
| Actually Spam | 50 (TP) | 10 (FN) |
| Actually Not Spam | 5 (FP) | 35 (TN) |
This confusion matrix example shows the model correctly identified 50 spam emails but missed 10. It also flagged 5 legitimate emails as spam. These numbers tell you exactly where the model struggles.
How to Read a Confusion Matrix
The confusion matrix diagram is split into four quadrants. Top-left and bottom-right are correct predictions. Top-right and bottom-left are errors.
True positives and true negatives
True Positives sit in the top-left when the positive class is in the first row. The model predicted positive, and the actual label was positive.
True Negatives sit in the bottom-right. The model predicted negative, and the actual label was negative.
Both represent correct predictions.
False positives and false negatives
False Positives (Type I error) appear in the bottom-left. The model predicted positive, but the actual label was negative.
False Negatives (Type II error) appear in the top-right. The model predicted negative, but the actual label was positive.
These are your blind spots. High FP means the model is too aggressive. High FN means it’s too cautious.
What Does a Confusion Matrix Tell You?
A confusion matrix shows you which classes your model confuses and how often. If one class has significantly more errors than others, that’s a red flag.
Common patterns:
- Class imbalance: if 90% of your data is one class, the model might ignore the minority class entirely
- Systematic bias: the model consistently misclassifies one specific class as another
- Edge case failures: rare scenarios that trip up the model
Case in point, a medical image recognition model detects tumors. High false negatives mean it’s missing actual tumors, which is dangerous. High false positives mean it flags healthy tissue, leading to unnecessary procedures. The matrix tells you which problem you have.
Catching these issues early means you can retrain with better data annotation or adjust your machine learning algorithm parameters. Label Your Data helps ML teams fix data quality issues that lead to systematic misclassifications.
How to Calculate Metrics from a Confusion Matrix
The raw counts in a confusion matrix explained feed into standard evaluation metrics. Each metric highlights a different aspect of performance.
Accuracy
- Accuracy measures overall correctness
- Formula: (TP + TN) / (TP + TN + FP + FN)
- It’s useful when classes are balanced but misleading when they're not.
Precision
- Precision confusion matrix measures how many positive predictions were actually correct
- Formula: TP / (TP + FP)
- Use this when false positives are costly (e.g., spam filters, fraud detection).
Recall
- Recall (sensitivity) measures how many actual positives the model found
- Formula: TP / (TP + FN)
- Use this when false negatives are costly (e.g., disease screening, safety systems).
F1 score
- F1 Score balances precision and recall
- Formula: 2 × (Precision × Recall) / (Precision + Recall)
- It’s helpful when you need a single metric that accounts for both types of errors.
Confusion matrix formulas
| Metric | Formula | What It Prioritizes |
| Accuracy | (TP + TN) / Total | Overall correctness |
| Precision | TP / (TP + FP) | Reducing false positives |
| Recall | TP / (TP + FN) | Reducing false negatives |
| F1 Score | 2 × (Precision × Recall) / (Precision + Recall) | Balance between both |
These metrics work for any classification task. For specialized applications like object detection, you might combine them with object detection metrics such as IoU and mAP for a more complete assessment.
Confusion Matrix for Multiclass Classification
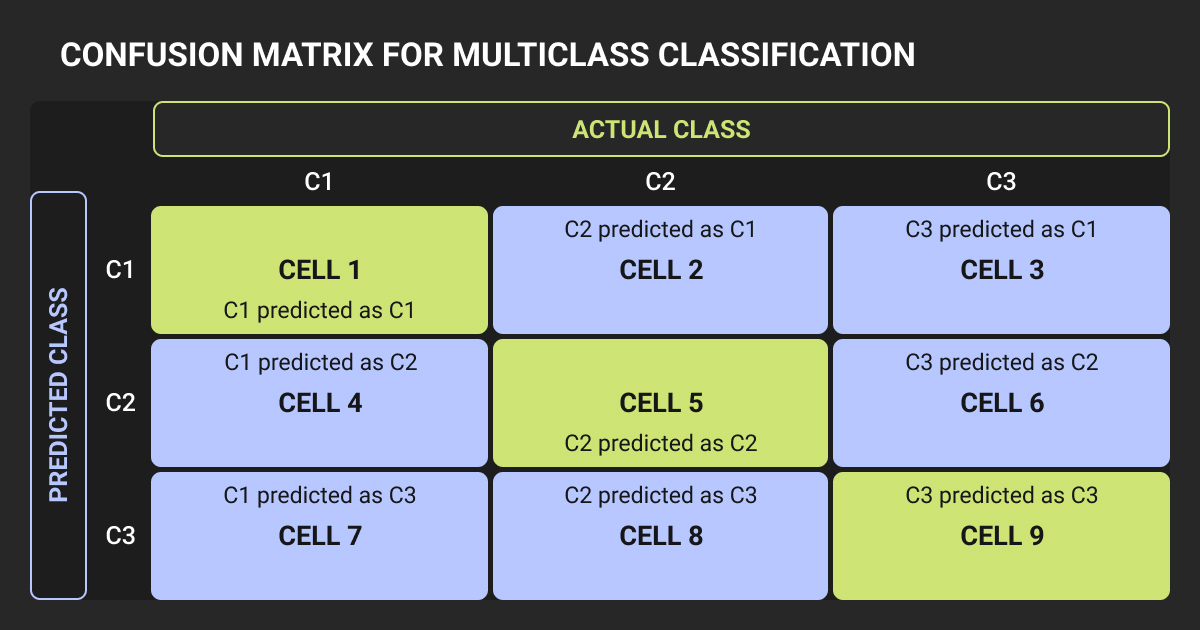
When you have more than two classes, the matrix expands into a multiclass confusion matrix. A 3-class problem gets a 3x3 matrix. A 10-class problem gets a 10x10 matrix.
Each row still represents actual labels, each column represents predictions. The diagonal shows correct predictions, off-diagonal cells show misclassifications.
To give you the full picture, let’s imagine we’re classifying images of dogs, cats, and birds. The matrix might show that our model frequently mistakes birds for cats but rarely confuses dogs with anything else. That tells us where to focus our retraining efforts.
Weak classes often appear as rows with low diagonal values and high off-diagonal values. If your "bird" row shows most predictions in the "cat" column, your model can’t tell birds apart from cats.
This breakdown helps prioritize which classes need more training examples from your machine learning datasets or better-labeled data from a data annotation company with transparent per-object pricing like Label Your Data.
When Should You Use a Confusion Matrix?
Use a confusion matrix when:
- Evaluating a classification model's performance on test data
- Debugging a model that performs worse than expected
- Checking for class imbalance or bias in predictions
- Comparing multiple models to see which makes fewer critical errors
- Explaining model behavior to non-technical stakeholders
It's most useful when you care about the type of error your model makes, not just overall accuracy.
Confusion Matrix vs ROC Curve
Both tools evaluate classifiers, but they show different information.
| Feature | Confusion Matrix | ROC Curve |
| What it shows | Counts of prediction outcomes | Trade-off between true positive and false positive rates |
| Best for | Understanding specific error types | Comparing models across thresholds |
| Output format | Table | Graph |
| Threshold dependency | Fixed threshold | Shows performance across all thresholds |
A confusion matrix is a snapshot at one decision threshold. An ROC curve shows how performance changes as you adjust that threshold. Use a confusion matrix to understand specific errors, then check the ROC curve to optimize your decision threshold.
How to Build a Confusion Matrix
Most machine learning libraries generate confusion matrices automatically. Tools like scikit-learn, TensorFlow, PyTorch, and data annotation tools with built-in evaluation features include these functions.
If you’re working in R, the caret package provides confusion matrix in R functions with built-in visualization.
If you’re building one manually, compare your model’s predictions against the actual labels in your test set. Count how many predictions fall into each category (TP, TN, FP, FN), then arrange them in a grid.
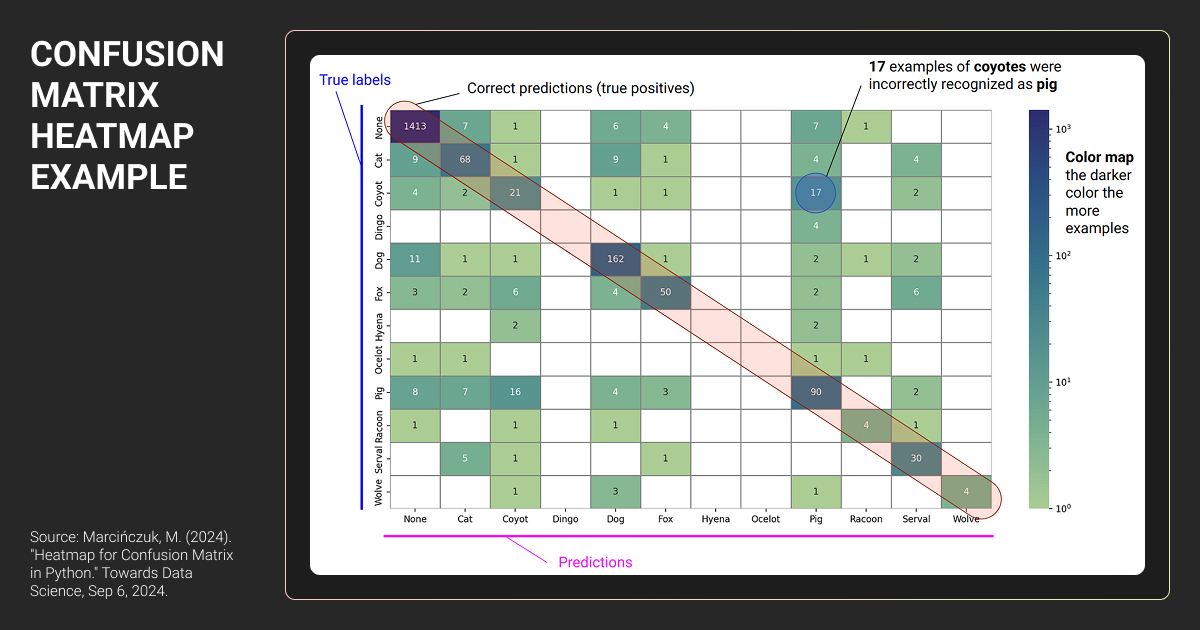
In addition, visualization like a confusion matrix heatmap helps. Heatmaps color-code the matrix to make patterns obvious. Darker colors often represent higher counts, so you can quickly spot where errors cluster.
Many ML platforms and dashboards (like TensorBoard or Weights & Biases) display confusion matrices as part of model evaluation reports. Online confusion matrix calculator tools can also help you quickly generate one from raw prediction counts.
Ready to Fix Your Model Blind Spots?
Confusion matrix in machine learning gives you a clear view of where your model succeeds and where it fails. Use it to catch blind spots early, refine your training data, and build more reliable classifiers.
Need high-quality labeled data to train better models? Label Your Data provides accurate annotations tailored to your use case through managed services or a self-serve data annotation platform.
Check our data annotation pricing and get in touch to improve your model’s performance from the ground up.
About Label Your Data
If you choose to delegate data labeling, run a free data pilot with Label Your Data. Our outsourcing strategy has helped many companies scale their ML projects. Here’s why:
Rely on consistent, high-quality output for complex datasets, detailed taxonomies, and edge cases.
Get quality engineered into every step through onboarding, evolving guidelines, QA, and continuous feedback.
Adjust team capacity, project size, and delivery model as you scale, with no setup fees or long-term lock-ins.
Align on goals, workflows, and expectations with a team that integrates into your process from day one.
Work with former annotators who understand annotation complexity, quality standards, and high-volume delivery.
FAQ
What is a 3x3 confusion matrix?
A 3x3 confusion matrix is used for classification problems with three classes. Each row represents the actual class, and each column represents the predicted class.
The nine cells show how many predictions fell into each combination. The diagonal cells (top-left, center, bottom-right) contain correct predictions, while off-diagonal cells show misclassifications between specific class pairs.
How to interpret confusion matrix?
- Check the diagonal: high numbers mean correct predictions
- Look at off-diagonal cells: these are your errors
- Find which classes get confused most often
- Compare false positives vs false negatives for each class
- Identify patterns like consistent misclassification between two specific classes
What is the difference between ROC and confusion matrix?
A confusion matrix shows raw counts of predictions at a single decision threshold, breaking down exactly which classes were confused. An ROC curve plots the true positive rate against the false positive rate across all possible thresholds, showing how model performance changes as you adjust sensitivity.
Use a confusion matrix when you need to understand specific error types. Use an ROC curve when comparing models or selecting the best threshold for your use case.
What is the main goal of creating a confusion matrix?
The main goal of machine learning confusion matrix is to see where your classification model makes mistakes. It breaks down errors by type so you can identify which classes get confused, whether the model is too aggressive or too cautious, and where to focus improvements. This helps you debug problems, refine training data, and build more reliable classifiers.
How to calculate recall from confusion matrix?
- Find True Positives (TP) in the matrix
- Find False Negatives (FN) in the matrix
- Add TP and FN together
- Divide TP by (TP + FN)
- The result is your recall score
How to calculate accuracy from confusion matrix?
- Add up all True Positives (TP) and True Negatives (TN)
- Add up all predictions: TP + TN + FP + FN
- Divide the sum of correct predictions by total predictions
- The result is your accuracy score
Written by
CEO of Label Your Data
Karyna is the CEO of Label Your Data, a company specializing in data labeling solutions for machine learning projects. With a strong background in machine learning, she frequently collaborates with editors to share her expertise through articles, whitepapers, and presentations.